how to draw candle
只能在主窗口画candle, separate Windows中只能画对0的直方图
MT不支持。
object画candle很是麻烦,考验耐心了。
呵呵,那位老兄还真是挖空心思!
他那个有很多其它东西,难怪你看不懂。
好吧,我给你个简单例子: 改天我提交网上。
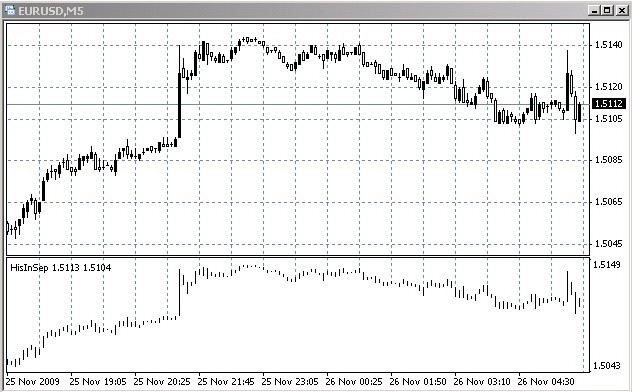
本指标使用直方图,只是两个直方图数组之一使用背景颜色,绘制后,就可得到竖线段模仿的蜡烛图。
注意:第二数组必须小于第一数组值。
//+------------------------------------------------------------------+
//| HisInSep.mq4 |
//| Copyright ?2007, MetaQuotes Software Corp. |
//| https://www.metaquotes.net/ |
//+------------------------------------------------------------------+
#property copyright "Copyright ?2007, okwh" //Draw HISTOGRAM char in subwindow 在副窗口画直方图的方法
#property link "https://www.mql5.com/zh/users/dxdcn"
#property indicator_separate_window
#property indicator_buffers 2
//---- buffers
double ExtMapBuffer1[];
double ExtMapBuffer2[];
extern color BK_color= White;
//+------------------------------------------------------------------+
//| Custom indicator initialization function |
//+------------------------------------------------------------------+
int init()
{
//---- indicators
SetIndexStyle(0,DRAW_HISTOGRAM,0, 1, Black);
SetIndexBuffer(0,ExtMapBuffer1);
SetIndexStyle(1,DRAW_HISTOGRAM,0, 1, BK_color);
SetIndexBuffer(1,ExtMapBuffer2);
//----
return(0);
}
//+------------------------------------------------------------------+
//| Custom indicator iteration function |
//+------------------------------------------------------------------+
int start()
{
int counted_bars=IndicatorCounted();
//----
for (int i=Bars-counted_bars+1;i>=0;i--)
{
ExtMapBuffer1[i]=High[i];
ExtMapBuffer2[i]=Low[i];
}
//----
return(0);
}
//+------------------------------------------------------------------+
原来如此!
顺便再问个问题,indexstyle是否有显示的层的顺序。
如果顺序是随机的,即便第二数组小于第一数组,
也有可能是背景颜色被遮住而失败。
如果有层的先后顺序,用这个方法画candle基本可行了!
多谢了!
如题,怎样在separate Windows里画candle呢?
createobject,只能靠垂直画线然后调整线的粗细来得到candle。但较粗的线的两端比较圆润,外观不好。
HISTOGRAM在separate Windows里以0为最下端,很是头痛,不知道有什么解决办法没有?