How does Ichimoku Indicator Achieve This Smooth Shading?
I would like to shade the area between two emas. I know there has been some discussion on this, but I can't find the right solution...
I just bought a dell alienware, and it has a 4k screen. So I thought I would mention that I am dealing with high resolution.
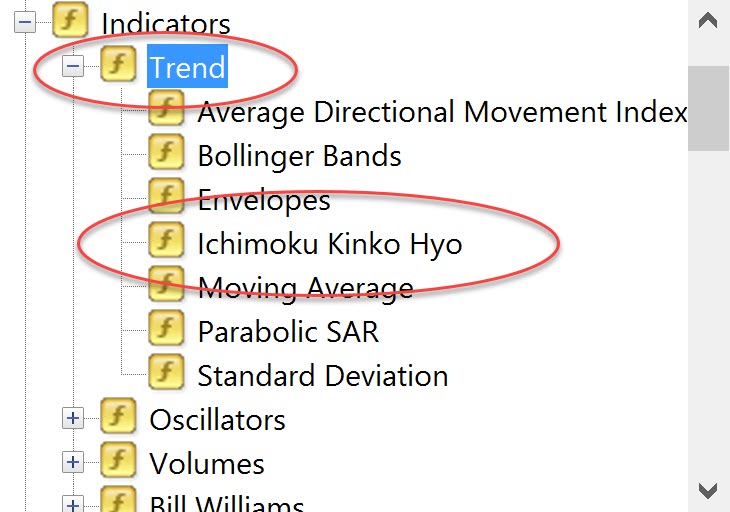
However, there are two ichimoku inidators; One under the trend tree tab, and one just sitting in the root list.
Here is what the ichimoku cloud looks like when you use scale 5 width - this is using the ichimoku indicator under the 'trends' tree under indicators. The one where you can't see the source code :|
This is what the chart looks like...
See how the cloud is filled nice and smoothly.
Now the other ichimoku indicator sitting in the indicator tree root, we can view that source code.
There have been suggestions on the forum to use STYLE_SOLID to get the fill effect.
Because I have a large res screen, I need to pump it up to such a high width using the following...
It take the input of 17 to finally fill the space... and this is what I end up with.,,
The fill effect looks disgusting and cheap.
Do you guys know how to get the proper smoothing effect from the first example. There obviously is a way to do it if the standard ichimoku can do it.
Thanks very much.
| It doesn't look like that on Mql4. That's what Mql5 can do. | 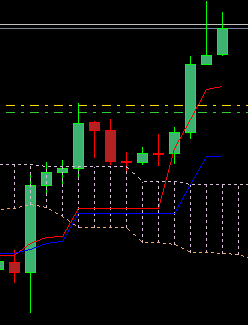 | 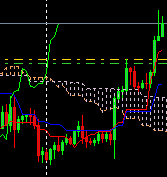 |
| It doesn't look like that on Mql4. That's what Mql5 can do. |
Incorrect.
I don't even have MQL5 installed.
There are two ichimoku indicators to choose from. Once under the 'trend' tree sub tab, and one under the the root directory of the indicators tree.
The example you show is the one under the root directory of the tree...
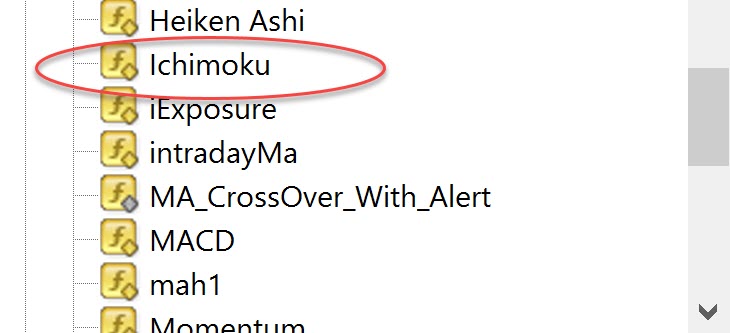
The one in the location above fills with the dotted line, and has the normal color tab.
However this one...
This one has the smooth shading I originally screen shotted, and it also has the better color tab ui. Basically it displays the buffer names.
Both show the same for me.
You have not followed the OP's instructions. If you set the line width to the thickest as he has indicated both in his text and as a screenshot, you will get the continuous/smooth shading he has mentioned.
It is however an internal/build-in indicator, so it could be that they have internally used MQL5 core base code for it.
Obviously MT4 can do this some way or another, it is a shame they don't reveal how they did it, and allow us to see the source code.
Thanks for sharing your thoughts.
Obviously MT4 can do this some way or another, it is a shame they don't reveal how they did it, and allow us to see the source code.
Thanks for sharing your thoughts.
Hi, did you guys figure it out, I'm struggling with the same problem. I know they used Histogram, but there has to be some extra line of code to smooth it/keep it within the boundaries of SSA and SSB. If yo have solution after all this years, I would appreciate.
- Free trading apps
- Over 8,000 signals for copying
- Economic news for exploring financial markets
You agree to website policy and terms of use
I would like to shade the area between two emas. I know there has been some discussion on this, but I can't find the right solution...
I just bought a dell alienware, and it has a 4k screen. So I thought I would mention that I am dealing with high resolution.
However, there are two ichimoku inidators; One under the trend tree tab, and one just sitting in the root list.
Here is what the ichimoku cloud looks like when you use scale 5 width - this is using the ichimoku indicator under the 'trends' tree under indicators. The one where you can't see the source code :|
This is what the chart looks like...
See how the cloud is filled nice and smoothly.
Now the other ichimoku indicator sitting in the indicator tree root, we can view that source code.
There have been suggestions on the forum to use STYLE_SOLID to get the fill effect.
Because I have a large res screen, I need to pump it up to such a high width using the following...
It take the input of 17 to finally fill the space... and this is what I end up with.,,
The fill effect looks disgusting and cheap.
Do you guys know how to get the proper smoothing effect from the first example. There obviously is a way to do it if the standard ichimoku can do it.
Thanks very much.