RSI of MA, is this correct?
any idea guys ?
by the way when I try to put this indicator on a char M30 or bigger, it waits about 10 minutes.
Buf_0[i]=iMA(Symbol(), PERIOD_CURRENT, xMAPeriod,0, MODE_SMA, PRICE_CLOSE, i);
Buf_1[i]=iRSIOnArray(Buf_0,0,xRSIPeriod,i);
Do you know what an RSI is? RS = Average( positive values ) / Average( negative values ); RSI = 100 - 100/(1 + RS);
The MA has no negative values, therefor RSI will ALWAYS be 100.
-
What do you think you'll see when you put line in the [100..-100] range on a price chart with the range (0.8609..0.82400)
Hi WHRoeder,
yes I know, but what when I put this indicator on a chart not all the values are 100. there is graphic, then what is that graphic. I would like to measure strength of MA, thats why I am trying to do this.
 i=Bars-Counted_bars-1;
   while(i>=0)
your code counts ALL BARS at the first start, check how many bars of history you
have loaded, reduce it or change your code to get fewer bars. another trick (mql4) is to do every XYZOnArray in an extra loop, i don't know why - but i often had problems with it.
replace start() and try this (untested).... note: bad counting, count exactly what you want and make sure you include enough bars for every step, thats your job ;)
int start() {
//--------------------------------------------------------------------
int lim = Bars - IndicatorCounted() - 1;
//--------------------------------------------------------------------
for(int i = lim; i >= 0; i--) Buf_0[i] = iMA(Symbol(), PERIOD_CURRENT, xMAPeriod,0, MODE_SMA, PRICE_CLOSE, i);
for(int i = lim; i >= 0; i--) Buf_1[i] = iRSIOnArray(Buf_0, 0 ,xRSIPeriod, i);
//--------------------------------------------------------------------
return;
}
@whroeder1
do you know that Rsi@Close is one of the well known indicators? and Close[x] is normally negative? so maybe i understand you wrong (my english is not very good) but for sure - you can use iRSIOnArray on whatever you want, IMA, Volume, MACD - even positive values?
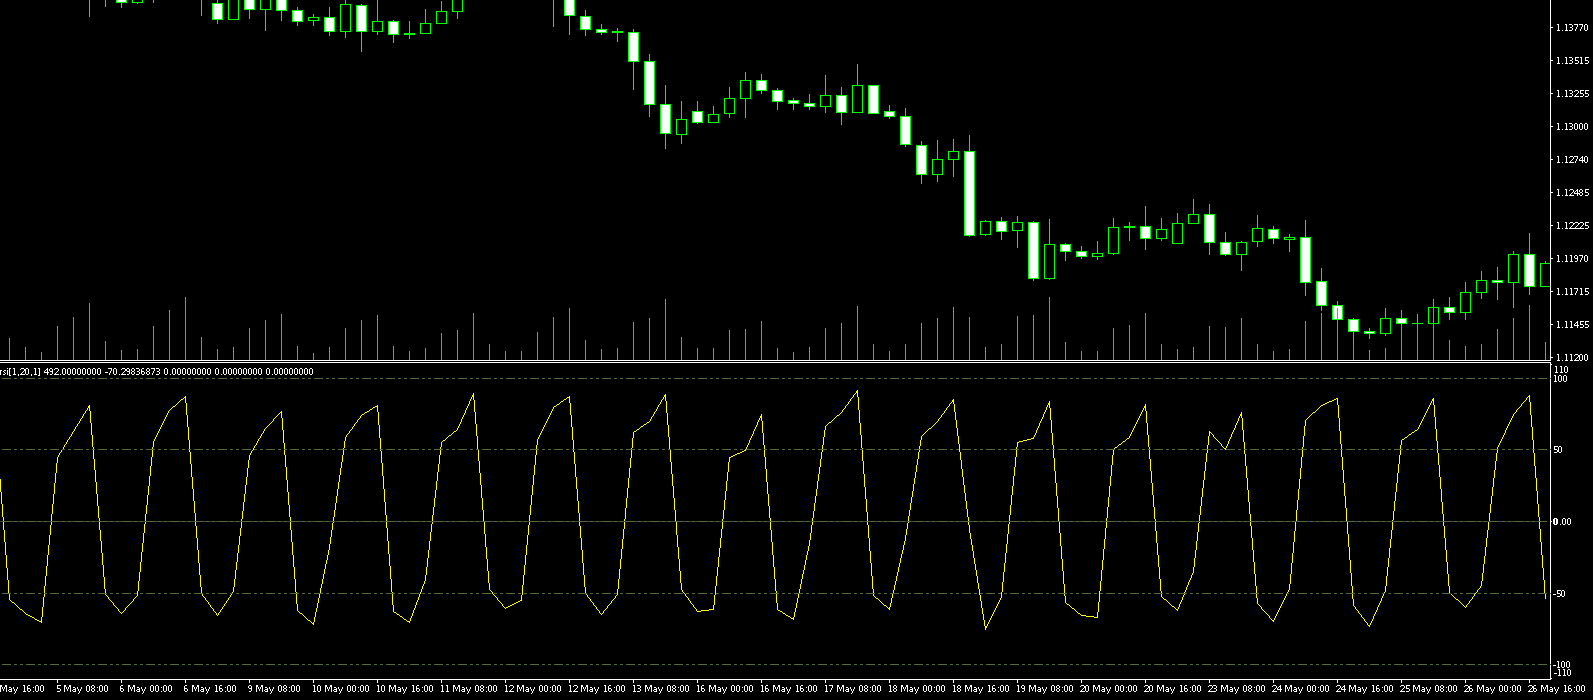
iRSIOnArray @ Volume on EURUSD H4
As I remember, you need to do 2 loops.
First count MA, than count RSIonArray
haha evil that's strange the thread is a little bit older - and now we have the same idea at the same time ? wtf ;)
haha evil that's strange the thread is a little bit older - and now we have the same idea at the same time ? wtf ;)
:)))
I did't read your message before I posted my.
?
for(int i = lim-xRSIPeriod; i >= 0; i--) Buf_1[i] = iRSIOnArray(Buf_0, 0 ,xRSIPeriod, i);
do you know that Rsi@Close is one of the well known indicators? and Close[x] is normally negative? so maybe i understand you wrong (my english is not very good) but for sure - you can use iRSIOnArray on whatever you want, IMA, Volume, MACD - even positive values?i
- Of course, it is the ratio of increasing X to decreasing X.
- Of course you can do it "on whatever you want."
- Let me rephrase. If price is above the MA, then every MA value will be increasing and the RSI will be at 100. So all it will show is wether the MA slope is positive or negative, delayed a few bars during cross over.
:)))
I did't read your message before I posted my.
?
for(int i = lim-xRSIPeriod; i >= 0; i--) Buf_1[i] = iRSIOnArray(Buf_0, 0 ,xRSIPeriod, i);
"note: bad counting, count exactly what you want and make sure you include enough bars for every step, thats your job ;)"
if lim == 1 or lim == 0 your calculation is negative ;)
ok lets do it:
int start() {
//--------------------------------------------------------------------
int lim = Bars - IndicatorCounted() - 1;
//--------------------------------------------------------------------
if(lim > xMAPeriod) lim -= xMAPeriod;
for(int i = lim; i >= 0; i--) Buf_0[i] = iMA(Symbol(), PERIOD_CURRENT, xMAPeriod,0, MODE_SMA, PRICE_CLOSE, i);
if(lim > xRSIPeriod) lim -= xRSIPeriod;
for(int i = lim; i >= 0; i--) Buf_1[i] = iRSIOnArray(Buf_0, 0 ,xRSIPeriod, i);
//--------------------------------------------------------------------
return;
}
and i need to say that i don't use IndicatorCounted(), it does not work in renko charts with sliding windows.
i have my own function xyz() and the result of it is 0, 1 or Bars - 1, no matter if you use timeframe based, renko or other charts...
@whroeder1
sorry i can't follow you? so if you want - maybe you can show a example of what you mean?
- Free trading apps
- Over 8,000 signals for copying
- Economic news for exploring financial markets
You agree to website policy and terms of use
Hello,
I want to measure RSI of MA. I found this code from code base and try to modify it, is this give me the correct result ? or is this the correct way to do it (because I believe it is not)?
My next goal is try to do it RSI of Any indicator data. I saw some indicators can be applied to previous indicator etc.
thanks,