How can i put objects in front all graphic elements ?


Hello.

I am creating some label objects, and need to put them in front all elements on the graphic window... but not works. Is there any specific property for that?


My code: 

void DrawBoxInformation(bool fixed=false){

   int y = 30;
   int x = 10;
   
   RectLabelCreate(0,"rectOrders",0,x,y,260,235,clrAliceBlue,BORDER_FLAT,CORNER_LEFT_UPPER,clrSteelBlue,STYLE_SOLID,2,false,fixed,true,0);

   RectLabelCreate(0,"rectTitle",0,x,y,260,32,clrSteelBlue,BORDER_FLAT,CORNER_LEFT_UPPER,clrSteelBlue,STYLE_SOLID,0,false,fixed,true,0);
   LabelCreate(0, "lblTitle", 0, x+5, 34, CORNER_LEFT_UPPER, "MULTISIGNAL EMITTER", "Arial Black", 12, clrWhite, 0.0, ANCHOR_LEFT_UPPER, false, fixed, true, 0);

}


bool RectLabelCreate(const long             chart_ID=0,               // chart's ID
                     const string           name="RectLabel",         // label name
                     const int              sub_window=0,             // subwindow index
                     const int              x=0,                      // X coordinate
                     const int              y=0,                      // Y coordinate
                     const int              width=50,                 // width
                     const int              height=18,                // height
                     const color            back_clr=C'236,233,216',  // background color
                     const ENUM_BORDER_TYPE border=BORDER_SUNKEN,     // border type
                     const ENUM_BASE_CORNER corner=CORNER_LEFT_UPPER, // chart corner for anchoring
                     const color            clr=clrRed,               // flat border color (Flat)
                     const ENUM_LINE_STYLE  style=STYLE_SOLID,        // flat border style
                     const int              line_width=1,             // flat border width
                     const bool             back=false,               // in the background
                     const bool             selection=false,          // highlight to move
                     const bool             hidden=true,              // hidden in the object list
                     const long             z_order=0)                // priority for mouse click
  {
//--- reset the error value
   ResetLastError();
//--- create a rectangle label
   if(!ObjectCreate(chart_ID,name,OBJ_RECTANGLE_LABEL,sub_window,0,0)){
      return(false);
   }
//--- set label coordinates
   ObjectSetInteger(chart_ID,name,OBJPROP_XDISTANCE,x);
   ObjectSetInteger(chart_ID,name,OBJPROP_YDISTANCE,y);
//--- set label size
   ObjectSetInteger(chart_ID,name,OBJPROP_XSIZE,width);
   ObjectSetInteger(chart_ID,name,OBJPROP_YSIZE,height);
//--- set background color
   ObjectSetInteger(chart_ID,name,OBJPROP_BGCOLOR,back_clr);
//--- set border type
   ObjectSetInteger(chart_ID,name,OBJPROP_BORDER_TYPE,border);
//--- set the chart's corner, relative to which point coordinates are defined
   ObjectSetInteger(chart_ID,name,OBJPROP_CORNER,corner);
//--- set flat border color (in Flat mode)
   ObjectSetInteger(chart_ID,name,OBJPROP_COLOR,clr);
//--- set flat border line style
   ObjectSetInteger(chart_ID,name,OBJPROP_STYLE,style);
//--- set flat border width
   ObjectSetInteger(chart_ID,name,OBJPROP_WIDTH,line_width);
//--- display in the foreground (false) or background (true)
   ObjectSetInteger(chart_ID,name,OBJPROP_BACK,back);
//--- enable (true) or disable (false) the mode of moving the label by mouse
   ObjectSetInteger(chart_ID,name,OBJPROP_SELECTABLE,selection);
   ObjectSetInteger(chart_ID,name,OBJPROP_SELECTED,selection);
//--- hide (true) or display (false) graphical object name in the object list
   ObjectSetInteger(chart_ID,name,OBJPROP_HIDDEN,hidden);
//--- set the priority for receiving the event of a mouse click in the chart
   ObjectSetInteger(chart_ID,name,OBJPROP_ZORDER,z_order);
//--- successful execution
   return(true);
}

bool LabelCreate(const long              chart_ID=0,               // chart's ID
                 const string            name="Label",             // label name
                 const int               sub_window=0,             // subwindow index
                 const int               x=0,                      // X coordinate
                 const int               y=0,                      // Y coordinate
                 const ENUM_BASE_CORNER  corner=CORNER_RIGHT_UPPER, // chart corner for anchoring
                 const string            text="Label",             // text
                 const string            font="Arial",             // font
                 const int               font_size=10,             // font size
                 const color             clr=clrWhite,               // color
                 const double            angle=0.0,                // text slope
                 const ENUM_ANCHOR_POINT anchor=ANCHOR_LEFT_UPPER, // anchor type
                 const bool              back=false,               // in the background
                 const bool              selection=false,          // highlight to move
                 const bool              hidden=true,              // hidden in the object list
                 const long              z_order=0)                // priority for mouse click
  {
//--- reset the error value
   ResetLastError();
//--- create a text label
   if(!ObjectCreate(chart_ID,name,OBJ_LABEL,sub_window,0,0)){
      return(false);
   }
//--- set label coordinates
   ObjectSetInteger(chart_ID,name,OBJPROP_XDISTANCE,x);
   ObjectSetInteger(chart_ID,name,OBJPROP_YDISTANCE,y);
//--- set the chart's corner, relative to which point coordinates are defined
   ObjectSetInteger(chart_ID,name,OBJPROP_CORNER,corner);
//--- set the text
   ObjectSetString(chart_ID,name,OBJPROP_TEXT,text);
//--- set text font
   ObjectSetString(chart_ID,name,OBJPROP_FONT,font);
//--- set font size
   ObjectSetInteger(chart_ID,name,OBJPROP_FONTSIZE,font_size);
//--- set the slope angle of the text
   ObjectSetDouble(chart_ID,name,OBJPROP_ANGLE,angle);
//--- set anchor type
   ObjectSetInteger(chart_ID,name,OBJPROP_ANCHOR,anchor);
//--- set color
   ObjectSetInteger(chart_ID,name,OBJPROP_COLOR,clr);
//--- display in the foreground (false) or background (true)
   ObjectSetInteger(chart_ID,name,OBJPROP_BACK,back);
//--- enable (true) or disable (false) the mode of moving the label by mouse
   ObjectSetInteger(chart_ID,name,OBJPROP_SELECTABLE,selection);
   ObjectSetInteger(chart_ID,name,OBJPROP_SELECTED,selection);
//--- hide (true) or display (false) graphical object name in the object list
   ObjectSetInteger(chart_ID,name,OBJPROP_HIDDEN,hidden);
//--- set the priority for receiving the event of a mouse click in the chart
   ObjectSetInteger(chart_ID,name,OBJPROP_ZORDER,z_order);
//--- successful execution
   return(true);
}
 
I don't understand what i am doing wrong. I've seen many indicators and EAs around the internet showing dialog boxes in front the graphic elements... but i cannot do it
 
Disable the "Chart on foreground" checkbox in the Chart Properties or in code ChartSetInteger(0,CHART_FOREGROUND,0,false)
 
Ovo:
Disable the "Chart on foreground" checkbox in the Chart Properties or in code ChartSetInteger(0,CHART_FOREGROUND,0,false)

Good.


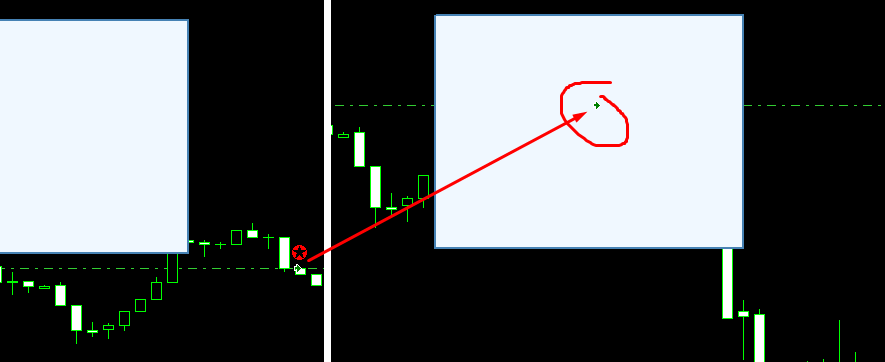
99% of window elements where overlapped by object, EXCEPT open orderns arrows... See the image.. below


The arrows when open/close orders... can i put the labels in front of them too?
 
wemersonrv: The arrows when open/close orders... can i put the labels in front of them too?
The objects are drawn in the order created, if you delete and recreate your object it works fine.
 
use this code when you creat your objects:
ObjectSetInteger(0,name,OBJPROP_BACK,false); 
 

If you watch for when an event has occurred that will create a new object afterwards, you can force a redraw with:

ObjectSetInteger(0,"objectname",OBJPROP_TIMEFRAMES,OBJ_NO_PERIODS);

ObjectSetInteger(0,"objectname",OBJPROP_TIMEFRAMES,OBJ_ALL_PERIODS);

Reason: