distance pivot point
- You are mixing bar shifts with price values: 1+i - High[1+i]
- You are missing parenthesis for the MathAbs() function or something else is wrong: MathAbs iCustom
- You also seem to be working with fractions of points which seems odd since you say that you want pips and not points: 0.5 * myPoint
- You have a semicolon out of place: ;
- As it stands, the code will not compile.
if(High[1+i] < iCustom(NULL, PERIOD_CURRENT, "Pivot_Points_-_Daily_sShiftedd", 5, 2, 1+i)
      && MathAbs     iCustom(NULL, PERIOD_CURRENT, "Pivot_Points_-_Daily_sShiftedd", 5, 2, 1+i - High[1+i]) < 0.5 * myPoint;
      )
Maybe, what you want is something like this:
double
   dblHigh       = High[ i + 1 ],
   dblPivot      = iCustom( NULL, PERIOD_CURRENT, "Pivot_Points_-_Daily_sShiftedd", 5, 2, i + 1 ),
   dblPivotDelta = MathAbs( dblPivot - dblHigh ),
   dblHalfPip    = 0.5 * myPoint;

if( ( dblHigh < dblPivot ) && ( dblPivotDelta < dblHalfPip ) )
{
   // Something
}
I mean that the pivot values and the maximum level of the candle must be read in the previous candle 1
in another I exploit my code this function to have the difference of these values, and I thought it could also work between indicator and candle.
MathAbs(Open [1+i] - Close[1+i]) > DojiGap * myPoint
my condition should be this: the pivot must be greater than the maximum level of the previous candle and set this difference in pips
a little help for me?
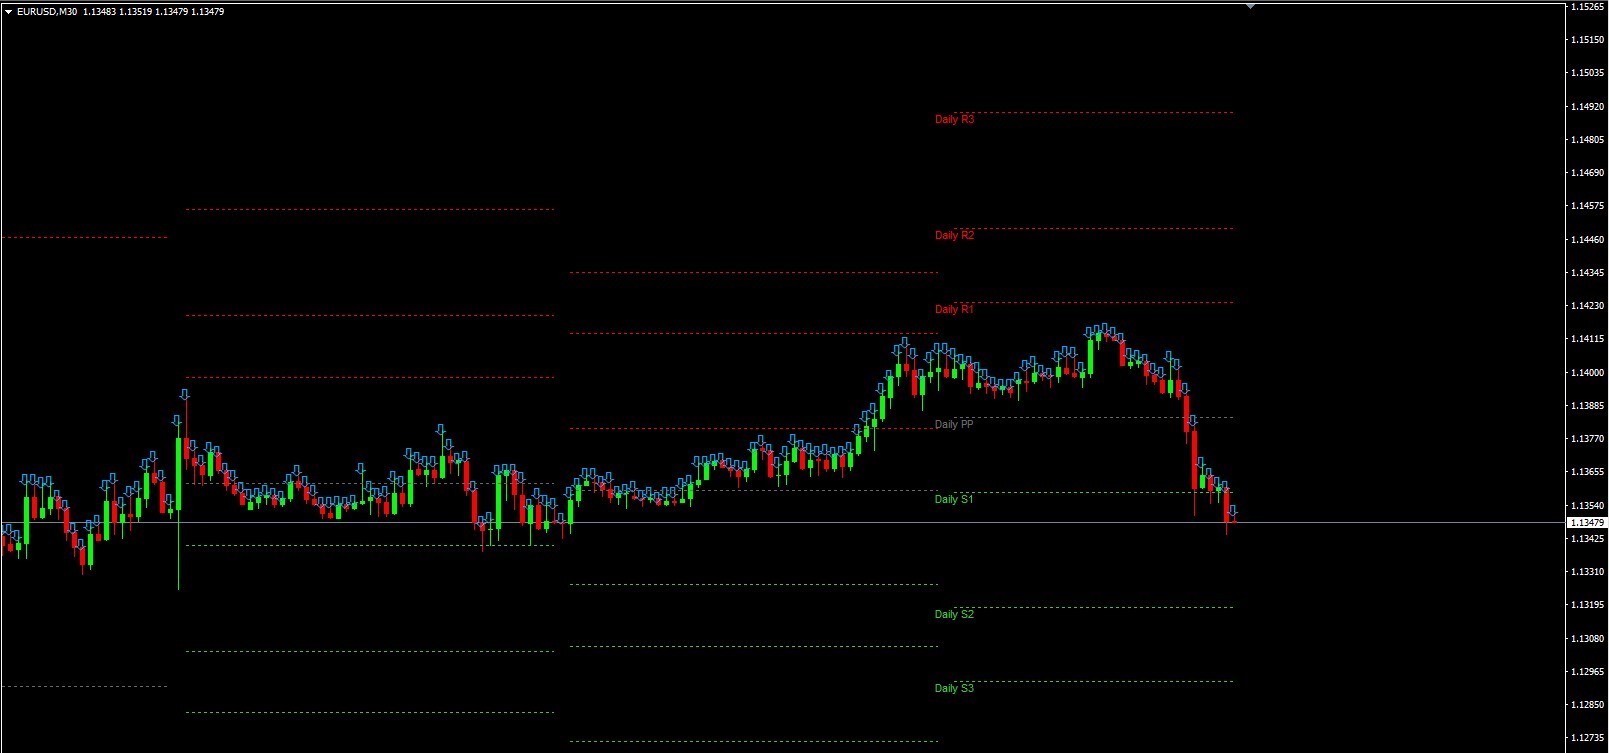
thank you for your intervention the code compiles without any problems, but I have this situation in the graph but instead should have the arrow only when we have the condition described in the code.
I mean that the pivot values and the maximum level of the candle must be read in the previous candle 1
in another I exploit my code this function to have the difference of these values, and I thought it could also work between indicator and candle.
my condition should be this: the pivot must be greater than the maximum level of the previous candle and set this difference in pips
a little help for me?
Sorry, but I did not understand what you trying to explain. What has that to do with the first part of the code?
Please provide a more complete sample code instead a small snippets so that we can understand what you are talking about.
However, first fix the first part of the code with the suggestions I have given.
Place the entire code to understand better how I wrote it. Your formula seems correct but no arrows appear in the graph
#include <stdlib.mqh>
#include <stderror.mqh>

//--- indicator settings
#property indicator_chart_window
#property indicator_buffers 1

#property indicator_type1 DRAW_ARROW
#property indicator_width1 1
#property indicator_color1 0xFFAA00
#property indicator_label1 "Sell"

//--- indicator buffers
double Buffer1[];

double myPoint; //initialized in OnInit

void myAlert(string type, string message)
  {
   if(type == "print")
      Print(message);
   else if(type == "error")
     {
      Print(type+" | M30 @ "+Symbol()+","+Period()+" | "+message);
     }
   else if(type == "order")
     {
     }
   else if(type == "modify")
     {
     }
  }

//+------------------------------------------------------------------+
//| Custom indicator initialization function                         |
//+------------------------------------------------------------------+
int OnInit()
  {
   IndicatorBuffers(1);
   SetIndexBuffer(0, Buffer1);
   SetIndexEmptyValue(0, 0);
   SetIndexArrow(0, 242);
   //initialize myPoint
   myPoint = Point();
   if(Digits() == 5 || Digits() == 3)
     {
      myPoint *= 10;
     }
   return(INIT_SUCCEEDED);
  }

//+------------------------------------------------------------------+
//| Custom indicator iteration function                              |
//+------------------------------------------------------------------+
int OnCalculate(const int rates_total,
                const int prev_calculated,
                const datetime& time[],
                const double& open[],
                const double& high[],
                const double& low[],
                const double& close[],
                const long& tick_volume[],
                const long& volume[],
                const int& spread[])
  {
   int limit = rates_total - prev_calculated;
   //--- counting from 0 to rates_total
   ArraySetAsSeries(Buffer1, true);
   //--- initial zero
   if(prev_calculated < 1)
     {
      ArrayInitialize(Buffer1, 0);
     }
   else
      limit++;

   //--- main loop
   for(int i = limit-1; i >= 0; i--)
     {
      if (i >= MathMin(5000-1, rates_total-1-50)) continue; //omit some old rates to prevent "Array out of range" or slow calculation
      //Indicator Buffer 1
      double
   dblHigh       = High[ i + 1 ],
   dblPivot      = iCustom( NULL, PERIOD_CURRENT, "Pivot_Points_-_Daily_sShiftedd", 5, 2, i + 1 ),
   dblPivotDelta = MathAbs( dblPivot - dblHigh ),
   dblHalfPip    = 0.5 * myPoint;

if( ( dblHigh < dblPivot ) && ( dblPivotDelta < dblHalfPip ) )
{
   Buffer1[i] = High[i]; //Set indicator value at Candlestick High
}

     }
   return(rates_total);
  }
//+------------------------------------------------------------------+
- You will have to provide the "Pivot_Points_-_Daily_sShiftedd" indicator if you want us to compile and test your code.
- Since I now see you full code, please change every occurence of "High[ ]" to "high[ ]".
- The following code is just "bogus". Don't just invent random bar counts. Do proper verification using the "rates_total" variable.
if (i >= MathMin(5000-1, rates_total-1-50)) continue; //omit some old rates to prevent "Array out of range" or slow calculation
- Set the array initialisation in the OnInit() event. There is no need to do it on every tick:
ArraySetAsSeries(Buffer1, true);
- Also set the Series flag for the "high" array in the OnCalculate() handler (and others that you may use such as the close or open):
ArraySetAsSeries( high,  true );
ArraySetAsSeries( close, true ); // place this line only if needed
thank you very much
i add the pivot code
this line is not 'necessary?
if (i >= MathMin(5000-1, rates_total-1-50)) continue; //omit some old rates to prevent "Array out of range" or slow calculation
I have to replace this line with these two?
ArraySetAsSeries(Buffer1, true);

ArraySetAsSeries( high,  true );
ArraySetAsSeries( close, true ); // place this line only if needed
thank you very much
i add the pivot code
this line is not 'necessary?
I have to replace this line with these two?
NO! NO! Please read again.
- I did not say it was not necessary. I said that you have to do it correctly because the values "5000" and "50" make no sense. You probably copy/pasted that from another person's code but have no idea what it is or what it is for. So, do it correctly.
- I did not say replace those two lines. I said MOVE the line "ArraySetAsSeries(Buffer1, true);" into the OnInit() function, and ADD the other two lines to the "OnCalculate()" function, but only add the "close" one if you plan to use the "close[]" array.
Here is the altered code. However, please note that a deviation of only half a pip is too small and results in no arrow shown. But if you use something like 5 pips or 15 pips of deviation, then the arrows are shown:
I have added many of the values as inputs to the indicator instead of fixed values so you can change them when testing.
PS! I edited the post and the code after the initial post, so copy it again if you were reading it while I was making the changes.#property strict //--- indicator settings #property indicator_chart_window #property indicator_buffers 1 #property indicator_type1 DRAW_ARROW #property indicator_width1 1 #property indicator_color1 clrOrange #property indicator_label1 "Sell" //--- define inputs input string strPivotIndicator = "Pivot_Points_-_Daily_sShiftedd"; // Name of Pivot Indicator input int intShiftHours = 5, // Pivot Day Shift in Hours intPivotMode = 3, // Mode for Pivot value in Indicator intSellArrowCode = 242; // Code of Sell Arrow input double dblMaxDevPips = 15.0; // Maximum Pivot to High Deviation in Pips // 0.5 is too small for the deviation. Use maybe 5 or 15 to see results. //--- variables and buffers double _Pip, // Pip Size dblMaxDev, // Maximum Pivot to High Deviation Buffer1[]; // Primary Buffer //--- Custom indicator initialization function int OnInit() { IndicatorDigits( _Digits ); IndicatorBuffers( 1 ); SetIndexBuffer( 0, Buffer1 ); SetIndexEmptyValue( 0, 0 ); SetIndexArrow( 0, intSellArrowCode ); ArraySetAsSeries( Buffer1, true ); // initialize Pip Size _Pip = _Point; if( ( _Digits == 5 ) || ( _Digits == 3 ) ) _Pip *= 10; // set minimum deviation value dblMaxDev = dblMaxDevPips * _Pip; return( INIT_SUCCEEDED ); } //--- Custom indicator iteration function int OnCalculate(const int rates_total, const int prev_calculated, const datetime& time[], const double& open[], const double& high[], const double& low[], const double& close[], const long& tick_volume[], const long& volume[], const int& spread[]) { //--- Counting down from rates_total (enable only when needed) //ArraySetAsSeries( open, true ); ArraySetAsSeries( high, true ); //ArraySetAsSeries( low, true ); //ArraySetAsSeries( close, true ); int intIndex, intPrevious, intLimit = ( prev_calculated < 1 ) ? rates_total - 1 : rates_total - prev_calculated; // Main Loop, Fill in the arrays with data values for( intIndex = intLimit, intPrevious = intIndex + 1; intIndex >= 0; intIndex--, intPrevious-- ) { Buffer1[ intIndex ] = 0; //Set initial Empty Value if( intPrevious < rates_total ) { double dblPivotPrev = iCustom( NULL, PERIOD_CURRENT, strPivotIndicator, intShiftHours, intPivotMode, intPrevious ); if( dblPivotPrev < EMPTY_VALUE ) { double dblHighPrev = high[ intPrevious ], dblPivotDelta = fabs( dblPivotPrev - dblHighPrev ); if( ( dblHighPrev < dblPivotPrev ) && ( dblPivotDelta < dblMaxDev ) ) Buffer1[ intIndex ] = high[ intIndex ]; //Set arrow at High Price } } } return( rates_total ); }
- Free trading apps
- Over 8,000 signals for copying
- Economic news for exploring financial markets
You agree to website policy and terms of use
In the first row I say that the maximum must be lower than the pivot point, the second row I mean that the pivot level minus the maximum level candle should be less than 0.5 pips.
Where am I wrong?
Thank you