Change the color of bulish and bearish

 
I wrote an indicator that shows Open of current candle is equal to Close of previous candle. but I don't know how to change the color of High/Low shadow for bullish and Bearish candles.

Is it possible to change the color of each candle in for loop?

is it possible to change the color of High/Low shadow for bearish and bullish candle same as body?

I attach my .mq4 file please have look. it take just a second time.

//+------------------------------------------------------------------+
//|                                                    Candle_OC.mq4 |
//|                   Copyright 2006-2016, MetaQuotes Software Corp. |
//|                                              http://www.mql4.com |
//+------------------------------------------------------------------+
#property copyright   "2006-2014, MetaQuotes Software Corp."
#property link        "http://www.mql4.com"
#property strict

#property indicator_chart_window
#property indicator_buffers 4
#property indicator_color1 White
#property indicator_color2 White
#property indicator_color3 Red
#property indicator_color4 White
#property indicator_width1 1
#property indicator_width2 1
#property indicator_width3 3
#property indicator_width4 3

//---
input color ExtColor1 = Red;
input color ExtColor2 = White;


//--- buffers
double NewLowBuffer[];
double NewHighBuffer[];
double NewOpenBuffer[];
double NewCloseBuffer[];
//+------------------------------------------------------------------+
//| Custom indicator initialization function                         |
//|------------------------------------------------------------------|
void OnInit(void)
  {
   IndicatorShortName("Candle_OC");
   IndicatorDigits(Digits);
//--- indicator lines
   SetIndexStyle(0,DRAW_HISTOGRAM,0,1,clrNONE);
   SetIndexBuffer(0,NewLowBuffer);
   SetIndexStyle(1,DRAW_HISTOGRAM,0,1,clrNONE);
   SetIndexBuffer(1,NewHighBuffer);
   SetIndexStyle(2,DRAW_HISTOGRAM,0,3,ExtColor1);   
   SetIndexBuffer(2,NewOpenBuffer);
   SetIndexStyle(3,DRAW_HISTOGRAM,0,3,ExtColor2);
   SetIndexBuffer(3,NewCloseBuffer);
//---
   SetIndexLabel(0,"Low/High");
   SetIndexLabel(1,"High/Low");
   SetIndexLabel(2,"Open");
   SetIndexLabel(3,"Close");
   SetIndexDrawBegin(0,10);
   SetIndexDrawBegin(1,10);
   SetIndexDrawBegin(2,10);
   SetIndexDrawBegin(3,10);
//--- indicator buffers mapping
   SetIndexBuffer(0,NewLowBuffer);
   SetIndexBuffer(1,NewHighBuffer);
   SetIndexBuffer(2,NewOpenBuffer);
   SetIndexBuffer(3,NewCloseBuffer);
//--- initialization done
  }
//+------------------------------------------------------------------+
//|                                                     |
//+------------------------------------------------------------------+
int OnCalculate(const int rates_total,
const int prev_calculated,const datetime &time[],
const double &open[],const double &high[],const double &low[],
const double &close[],const long &tick_volume[],
const long &volume[],const int &spread[])
  {
   int   i,pos;
//---
   if(rates_total<=10)
      return(0);
//--- counting from 0 to rates_total
   ArraySetAsSeries(NewLowBuffer,false);
   ArraySetAsSeries(NewHighBuffer,false);
   ArraySetAsSeries(NewOpenBuffer,false);
   ArraySetAsSeries(NewCloseBuffer,false);
   ArraySetAsSeries(open,false);
   ArraySetAsSeries(high,false);
   ArraySetAsSeries(low,false);
   ArraySetAsSeries(close,false);

   NewLowBuffer[0]=low[0];
   NewHighBuffer[0]=high[0];
   NewOpenBuffer[0]=open[0];
   NewCloseBuffer[0]=close[0];

   for(i=pos+1; i<rates_total; i++)
     {
      NewLowBuffer[i]=low[i]; 
      NewHighBuffer[i]=high[i];
      NewOpenBuffer[i]=close[i-1];
      NewCloseBuffer[i]=close[i];      
      if(NewOpenBuffer[i]<NewCloseBuffer[i]) SetIndexStyle(1,DRAW_HISTOGRAM,0,1,clrWhite);
      else if(NewOpenBuffer[i]>=NewCloseBuffer[i]) SetIndexStyle(1,DRAW_HISTOGRAM,0,1,clrRed);
      
     }
               
      return(rates_total);     
}
//+------------------------------------------------------------------+


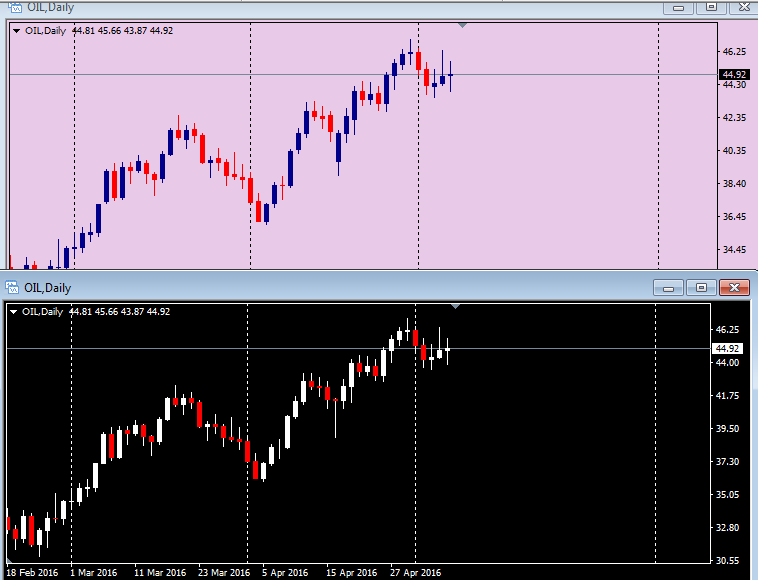
my shadow is white for bullish and bearish . I want to be the same color as body.


You don't need an Indicator to change the colours of the candles (body or shadow). Just set them in the Properties (F8 -> Colors) of the Chart and then Save it as a Template (e.g. Default template):

Chart Properties

 
Actually I need a kind of chart that Open of any Candle is equal to Close of Previous candle.
 

Hello

Actually I need a kind of chart that Open of any Candle is equal to Close of Previous candle.

I mean this type of candle

for(i=pos+1; i<rates_total; i++)
     {
      NewOpenBuffer[i]=close[i-1];
      NewCloseBuffer[i]=close[i]; 
      NewLowBuffer[i]=  MathMin(NewOpenBuffer[i],low[i]);
      NewHighBuffer[i]= MathMax(NewOpenBuffer[i],high[i]);      
                    
     }

I have 4 buffers for High-Open-Low-Close.


my External color:

input color ExtColor1 = Red;
input color ExtColor2 = LightSeaGreen;
 

and my SetIndexStyle:

   SetIndexStyle(0,DRAW_HISTOGRAM,0,1,clrWhite);
   SetIndexBuffer(0,NewLowBuffer);
   SetIndexStyle(1,DRAW_HISTOGRAM,0,1,clrWhite);
   SetIndexBuffer(1,NewHighBuffer);
   SetIndexStyle(2,DRAW_HISTOGRAM,0,3,ExtColor1);  
   SetIndexBuffer(2,NewOpenBuffer);
   SetIndexStyle(3,DRAW_HISTOGRAM,0,3,ExtColor2);

   SetIndexBuffer(3,NewCloseBuffer);


I just want to change the  color of shadows same to body of my candles. I don't know how to do that .
Files:
candle_oc.mq4  4 kb
 

Take a look at the "Heiken Ashi" indicator provided by MetaQuotes. You will be able to learn how to do what you want from that code.

You will find the "Heiken Ashi.mq4" file in your "Indicators" folder.


To tell the truth I changed the heiken ashi chart to my own chart, 

Maybe I should define 6 buffer : 2 buffer for open and close with differrent colors and 2 buffer for high and 2 buffer for low

if close>open then it is a bullish and use the the buffer of high which is related to bullish color and so on and so forth.

Any idea?? 

 
masoud0455_a:

To tell the truth I changed the heiken ashi chart to my own chart, 

Maybe I should define 6 buffer : 2 buffer for open and close with differrent colors and 2 buffer for high and 2 buffer for low

if close>open then it is a bullish and use the the buffer of high which is related to bullish color and so on and so forth.

Any idea?? 


Yes. Drop the Heiken Ashi, make it all one color and create objects
 
Doerk:
Yes. Drop the Heiken Ashi, make it all one color and create objects. 
Objects ? What to do ? It's always better to use buffers.
 
Doerk:
Yes. Drop the Heiken Ashi, make it all one color and create objects. 

Sorry to say this, but that is a very BAD choice for this case. He is recreating candle bars. Buffers is the RIGHT way to go and the Heiken Ashi is the example he should use.

 
masoud0455_a:

To tell the truth I changed the heiken ashi chart to my own chart, 

Maybe I should define 6 buffer : 2 buffer for open and close with differrent colors and 2 buffer for high and 2 buffer for low

if close>open then it is a bullish and use the the buffer of high which is related to bullish color and so on and so forth.

Any idea?? 


@masoud0455_a: The Heiken Ashi I have only uses 4 buffers. All you have to do is substitute the calculations of the haOpen, haClose, haHigh and haLow for your own values that you wish to use.

The trick that is used in the Heiken Ashi indicator to getting the colours correct is to switch the High and Low values when the bar is in the opposite direction. So make sure you do not remove that functionality.

Files:
Reason: