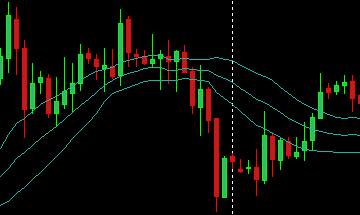
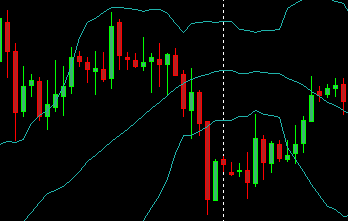
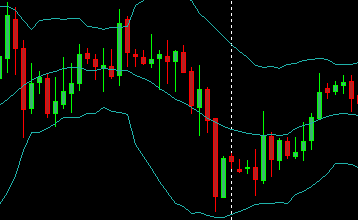
Check the documentation for accessing built-in Bollinger indicator.
What is your definition of a trend? How do you recognize it? To access history data check the documentation.
My Problem is, I don't know how to program that...?
For me is a trend this one. With two confirmations! (2 lows and 2 highs!)
But I also must know if its a down or uptrend

Okay, thank you!
I know that I must programm it self!
But I have problems to understand the documentation... https://docs.mql4.com/indicators/ibands
What is meaned by "deviation, bands_shift, applied_price, mode, shift"?
I know there is a description below, but I don't know what is meaned...
I just want to know, if the market is touching one of the 3 bollinger bands and if yes, which one? - Would be very happy, if somebody could help me...
What is meaned by "deviation, bands_shift, applied_price, mode, shift"?
I just want to know, if the market is touching one of the 3 bollinger bands and if yes, which one?
- You have to define which BB, there are an infinite number of them.
Deviation The documentation says "Number of standard deviations from the main line" BB is the main SMA line plus/minus n standard deviations from the line. 
What multiplier do you want? 
bands_shift Shifting the bands left or right. Same as shifting moving averages 
Normally zero 
applied_price Applied price. It can be any of ENUM_APPLIED_PRICE enumeration values. Usually it's the close of the bar is used. mode Indicator line index. It can be any of the Indicators line identifiers enumeration value (0 - MODE_MAIN, 1 - MODE_UPPER, 2 - MODE_LOWER). Which line do you want? shift Index of the value taken from the indicator buffer (shift relative to the current bar the given amount of periods ago). Which candle do you want? - Define touch. Do you mean touching lower is Low[s] below iBands(NULL,0, Len, Dev, 0, PRICE_CLOSE, MODE_LOWER, s) and High[s] is above? What if it is touching more than one?
- Code it.
- Free trading apps
- Over 8,000 signals for copying
- Economic news for exploring financial markets
You agree to website policy and terms of use
Hey Community,
I'am a Java programmer and the MQL language is very simular to Java. So I want to write my own trading robot :)
But I have a few problems...
For my strategy is it very important to know, if Ithe market actually in a up- or /down-trend and if the market is touching the Bollinger Bands.
My question now is, how can i proof that?
Greetings and Thank you!