Charts with Moving Averages
Rastenburg: I have screen shots of H1 to M1 attatched.
| No you don't. Don't attach a image, insert the image 
|
Rastenburg: I have screen shots of H1 to M1 attatched. | No you don't. Don't attach a image, insert the image |
Rastenburg: the 2 shots are in docx file.
| Then they aren't images and DOCX can't be attached.
 |
WH's screen shot even shows you which button to use when inserting pictures.
and his next post, he informs the OP that docx files are not image files, so the button for inserting pictures is no use in this case.
So what is your point?
and his next post, he informs the OP that docx files are not image files, so the button for inserting pictures is no use in this case.
So what is your point?
Hi to all who have answered,
I have finally come around to get the pics to images.
That was my original question:
I am using the MT4 and have a display problem in the charts with Moving Averages in timeframes. It starts with H4, I have screen shots of H1 to M1 attatched. As seen the averages become the look of a rainbow. I would appreciate if one could solve the problem. Thanks and greetings from Cologne.
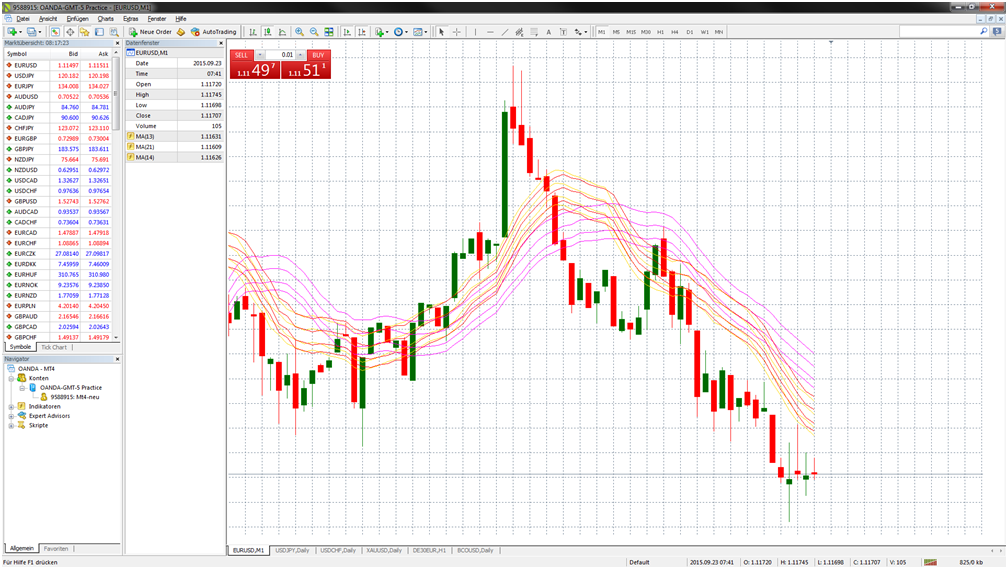
Rastenburg:
I am using the MT4 and have a display problem in the charts with Moving Averages in timeframes. As seen the averages become the of a rainbow. I would appreciate if one you can solve the problem. |
|
What are you talking about?
Your Pictures don't show Moving Averages as they are build in.
Rastenburg: I am using the MT4 and have a display problem in the charts withMoving Averages in timeframes. As seen the averages become the of a rainbow. I would appreciate if one you can solve the problem. |
|
- Free trading apps
- Over 8,000 signals for copying
- Economic news for exploring financial markets
You agree to website policy and terms of use
Hi and Good Morning, I am using the MT4 and have a diplay problem in the charts with Moving Averages in timeframes. It starts with H4, I have screen shots of H1 to M1 attatched.
As seen the averages become the of a rainbow. I would appreciate if one you can solve the problem. Thanks and greetings from Cologne.