ThirdBrainFx Market Commentary

 
Hi All,

We would like to offer a daily technical analysis based market commentary to the MQL4 community on this thread. You are most welcome to share your views and participate in a constructive manner.

Thanks.
 
Market Commentary – February 13, 2014

This morning, the Australian Bureau of Statistics released the employment change in the economy that measures the number people gained employment during the last month. The figure came out at -3700 against previously forecasted at 15,300, a huge decline indeed. The Bureau of Statistics also released the unemployment rate for the economy, which came out at 6% against forecasted 5.9.

Later in the day, the American Census Bureau will release the change in the total value of sales at the retail level, excluding automobiles, known as month over month, core retail sales data. The usual retail sales figure includes automobile sales. However, the car sales are often very volatile that makes the retail sales fluctuate heavily. Since the core retail sales data exclude car sales data, it tends to represent more accurate picture of the economy.

The US Department of Labor will also release the weekly unemployment figure. This figure is considered to be the most earliest economic data. This week, the unemployment change is forecasted to come out at 331K, which is the exact same figure from last week.

EURNZD Outlook

The EURNZD pair is fighting hard to say above the previous major support level at around the 1.6230 region.The pair is also seen flirting with the 61.8% Fibonacci retracement level of the last up-move from 1.5912 to 1.6995 levels. The recent comments from the ECB officials are weighing on the Euro in the short term, and as a result most of the Euro pairs are trading lower Intraday.

There is also an up-move trend line, as shown in the daily chart below. This trend line also acted as a support for the pair. So, there is a confluence of supports around the 1.6220/30 level. The pair again failed at around the 1.6560 level, and traded lower. A breach of the mentioned confluence level may trigger larger losses for the pair, and it might target the full 100% extension, which is at around the 1.5910 level. However, before that the key psychological level of 1.6000 may come into play as a support.

<picture removed by moderator>

If the pair manages to bounce from the current levels, then we can see the pair trading above the 1.6420 level again.A breach of this level may again push the pair towards the major barrier at around the 1.6560/80 region. The RSI is struggling to take out the 50 level, which is not a good sign. If it manages to break and close above the same, then we can expect some more gains for the pair in the short to medium term.

USDCHF Outlook

USD/CHF yesterday faced rejection around channel resistance and since then the price has been carrying on downside movement, it appears that downside breakout through daily triangle might be in play very soon.

Price has been moving in sideways since last few days; however a breakout shall provide clear direction on either side. The pair is being traded around 0.8984 at 5:25 GMT in Asia. Immediate resistance can be noted near upper channel of triangle which is currently near 0.9023. A break and daily close above channel resistance shall expose 0.9070, 38.2% fib level, ahead of 0.9155 which is swing high of last major upward wave.

<picture removed by moderator>

On downside, immediate support is being noted around lower channel of triangle that is currently near 0.8946, a downside breakout through daily triangle shall accelerate bearish momentum hence targeting 0.8882 which is 76.4% fib level, ahead of 0.8800, psychological level and swing low of last major downward wave.

Both Relative Strength Index (RSI) and Commodity Channel Index (CCI) are hovering around neutral territory which means the pair is currently directionless as we mentioned earlier. Signal line of MACD is also flat with very small histogram readings as shown in above chart, this also indicate lack of clear direction.

Today we have a few major economic reports scheduled for release that include Germany’s harmonised consumer price index for January, ECB monthly report, US retail sales data for January, initial jobless claims and Yellen speech. Since USD/CHF has good negative correlation with EUR/USD, so volatility could be expected in former pair amid Eurozone releases.
 
Market Commentary – February 14, 2014

Earlier today, the Chinese National Bureau of Statistics released the year over year consumer price index, which came out at 2.5% against previously forecasted 2.4%. This economic indicator measures the change in the price of goods and services purchased by consumers, which indicates inflation level in the economy.

Later in the afternoon, the Statistics Canada will release the month over month manufacturing sales figure that measures changes in the total value of sales made by manufacturers in the economy. Since manufacturers are quickly affected by market conditions, changes in their sales can be an early signal of future activity level in the economy.

The University of Michigan will be releasing the Prelim Consumer Sentiment at 2:55 PM. This is an index that measures level of a composite based on consumer survey. The UoM asks 500 consumers to respond and rate the relative level of current and future economic conditions to figure out the consumer sentiment about the economy. Consumer spending has a big impact on the overall economic growth and investors pay keen attention to this index.

Gold Outlook

Gold price has jumped more than $20 an ounce during past 24 hours after downbeat US data and China’s growth optimism, the precious metal is however likely to resume correction from current levels, according to price action analysis.

At the time of writing this article, the yellow metal is being traded near $1305, the highest level since November. Immediate hurdle can be seen around $1307, channel resistance and 200 Daily Moving Average (DMA), ahead of $1318, 76.4% fib level. A sustained move above channel resistance might result in renewed bullish momentum, hence targeting $1352 or even beyond that level.


On downside, support can be noted at $1292, 61.8% fib level, ahead of $1271 which is 50% fib level, and then channel support (currently around $1263). A daily close below channel support could expose $1250 support area and then $1244, 50% fib level of the most recent move.

Retail sales in the US during January slid down by 0.4% and followed a revised 0.1% drop in a month before, a report released by the US commerce department revealed yesterday. Moreover, the number of people, claiming unemployment incentives, ticked up by $8,000 to 339,000 last week, a separate report by the US labor department showed. Analysts were expecting no change in retail sales and a decline by 1,000 in jobless claims. On Wednesday, Chinese authorities said that countries exports jumped by 10.6% in January, fueling growth optimism about the Asian nation. Economists had predicted only 2% increase in exports amid lunar vacations. China is the biggest consumer of bullion.

EURCHF Outlook

The EUCHF pair has been hit by the recent poor data for the US. The safe heavens are gaining bids for the last several days now. The pairs like USDCHF, USDJPY and EURCHF are trading lower. Also, the commodities like GOLD and SILVER are trading higher. I think the EURUCHF still remains supported on dips. However, the pair is again reaching a crucial junction, in my opinion.

Recently, the pair formed a channel, as shown in the 4 hour chart. The pair has breached this channel, and currently trading lower. Now, this can be considered as a critical break, as the pair is approaching crucial support region at around the 1.2200-1.2180 levels. The 1.2180 is a very important level. It would be interesting to see whether the pair manages to hold this or not. A breach of this level may call for further losses for the pair may be towards the 1.2120 level.


If the pair manages to bounce from the 1.2180 support level, then it would be a good sign. However, the pair will face a lot of resistance on the way up. Starting with the broken channel support area at around the 1.2220/30 levels. Only a break and close above these levels may put the pair back in the positive zone. The RSI is coming closer to the extreme levels, which suggest that there might be a relief for the pair in the short to medium term.
 
Market Commentary - February 17, 2014

There were plenty of economic data released during the weekend. The most important was the retail sales figure from Statistics New Zealand, which came out at 1.2% against previously forecasted 1.7%. The retail sales data is considered to be a primary gauge of consumer confidence as it measures the changes in the total value of inflation adjusted sales at the retail level.

The Australian Bureau of Statistics released the new motor vehicle sales data at GMT 12:30 AM. This economic indicator measures changes in the number of new cars and trucks domestically sold during the past month. As this data is a vitally related to consumer sales, and correlate to the sign of consumer confidence, investors keep a keen eye on the figure to predict future economic activity.

USDCHF Outlook

The USDCHF pair has been hit by the recent greenback and the risk-on sentiment. The pair failed above the 0.9080 level, and traded lower. The pair is again trading below the key 0.8980 swing level. The fall in the US dollar in the recent days has been consistent, and it has failed to gain any sort of ground against most of the major currencies.

Looking at the daily chart of USDCHF, the pair has breached 61.8% Fibonacci retracement level of the last major up-move from the 0.8798 to 0.9155 level. The pair has been trading just below the key fib support level, which means that the pair might eye the full 100% extension at around the 0.8800 level. If the pair is unable to rebound from the current levels, then we may witness some more losses for the pair in the short to medium term. There is also a down-move trend line, which is acting as a major hurdle for the pair. Until the pair is trading below this trend line, then bearish bias is favored for the pair.


On the downside, a breach of 0.8800 level may call for a new lows in the pair. On the upside, 0.9000 level may act as a barrier for the pair. A break above this level might call for a test of the down-move trend line. The RSI is below the 50 level, and has struggled to trade above the same for quite some time now, which means the pair might remain under pressure for time.

EURUSD Outlook


The EURUSD broke the downward sloping equidistant channel since late December, last year. It tested the upper trend line on February 11, but failed to close above, and ended up forming a bearish pin bar on the daily time frame. However, a day later, on February 13, the EURUSD managed to close above the trend line and reached the resistance zone around the 1.3700 level.

For last few days, this pair is consolidating around this resistance zone. Meanwhile, the MACD has crossed above the 0 line, and the MACD signal line is about to cross over 0, towards positive value. If the EURUSD observe further bullish buying pressure, it may move towards the next resistance zone, around the 1.3795 level.


I think the EURUSD is nearing a critical resistance zone at around the 1.3770/80 level. This area represents a major overlap junction where the sellers are expected to return. There is also an up-move channel formed by the pair on the 4 hour chart, as shown below. The channel resistance level coincides with the mentioned area. So, we can say that there is a confluence of resistances around the same region.

Only a break and close above the 76.4% fib level will increase the bullish pressure on the pair. And, then the buyers might try to push the pair towards the 1.3890 level again. So, I am watching this level very closely in the short term.

 
ajpipsmaker:

I think the EURUSD is nearing a critical resistance zone at around the 1.3770/80 level. This area represents a major overlap junction where the sellers are expected to return. There is also an up-move channel formed by the pair on the 4 hour chart, as shown below. The channel resistance level coincides with the mentioned area. So, we can say that there is a confluence of resistances around the same region.

Only a break and close above the 76.4% fib level will increase the bullish pressure on the pair. And, then the buyers might try to push the pair towards the 1.3890 level again. So, I am watching this level very closely in the short term.


Thanks for sharing your views man. It was very useful for me. Especially the chart which you have shared saved me and stopped me from doing a blunder. I was planning on buying the EURUSD yesterday at the current level. However, I stopped after I look into the chart you shared.

I have also plotted the same trend line on my chart as well. Now, I am also monitoring this trend line very closely. BTW do you think that the pair can manage to break higher above this trend line? Or do you think the pair might continue to trade lower from the current levels? Please share your views. Thanks a lot.

 
sanjusharmaDHP:


Thanks for sharing your views man. It was very useful for me. Especially the chart which you have shared saved me and stopped me from doing a blunder. I was planning on buying the EURUSD yesterday at the current level. However, I stopped after I look into the chart you shared.

I have also plotted the same trend line on my chart as well. Now, I am also monitoring this trend line very closely. BTW do you think that the pair can manage to break higher above this trend line? Or do you think the pair might continue to trade lower from the current levels? Please share your views. Thanks a lot.


Anytime sanjusharmaDHP. I am glad that the analysis was useful. Most important thing is that it saved some bucks. However, we need to be careful here in the short term. As I shared earlier, there is a channel forming. The upper resistance zone proved vital, and now the pair is coming close to the channel support area.

There is also a critical swing support at around the 1.3680/60 levels. The sellers might find it hard to break this support area in one go. So, we may witness some consolidation. I am not sure here. And, one of my rules is that when I am not sure, I stay away for some time. So, I will wait for some time and monitor price action carefully. Thanks.


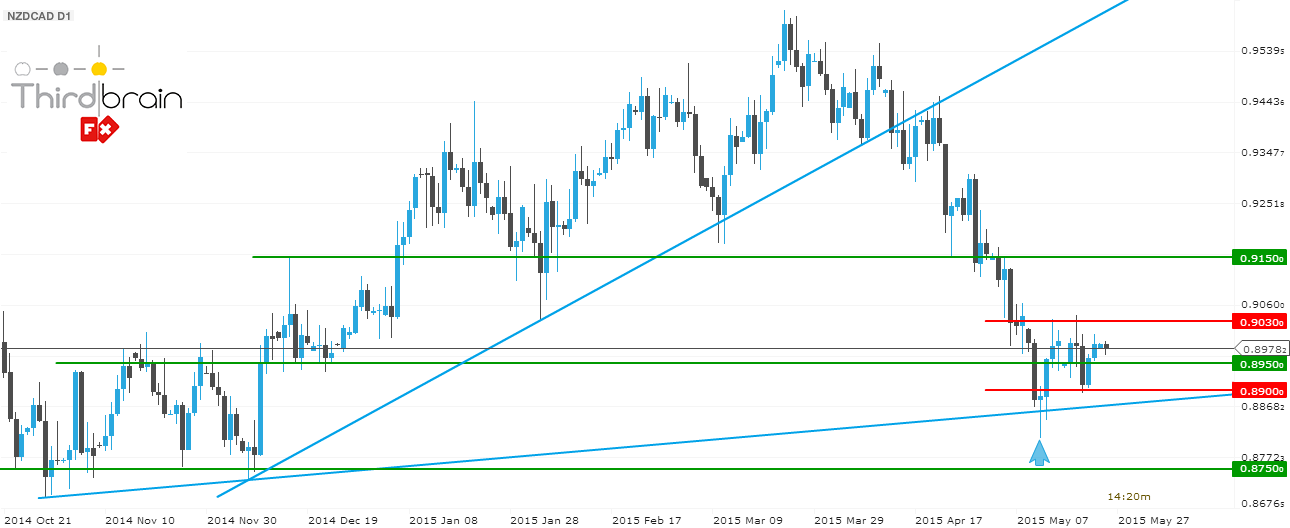
 New Zealand Trade Balance May Push the NZD/CAD Price Out of its Current Narrow Range This Week


Although Monday would be a bank holiday in some of the major economies around the world, including the United States, there are some major data releases scheduled in the coming few days to move the global Forex markets.

On Monday, at GMT 10:45 p.m., the Statistics New Zealand will release the national trade balance figure, which measures the difference in value between net import and export of products and services over the previous month.

Since export demand is directly correlated to the currency demand of the New Zealand Dollar, Forex market participants consider the trade balance to be a very important fundamental indicator.

In the end of April, the trade balance figure of New Zealand came out at 631 million and the forecast for May is currently set at 105 million.
Later in the week, on Wednesday, at GMT 2:00 p.m., the Bank of Canada (BOC) will release the overnight rate, which measures the interest rate that major banks and financial institutions in Canada uses to borrow and lend funds between themselves.

Overnight interest rates are the main factor in the valuation of any fiat currency and Forex traders often analyze all other fundamental indicators in order to predict future monetary policy and rate decisions. Hence, any substantial change in the BOC overnight rate can create unprecedented volatility in the global Forex market.

The Bank of Canada kept its overnight interest rate at 0.75% since January 2015 and the forecast for May is that the BOC will keep it at 0.75% for the time being. 

NZD/CAD Outlook


The NZD/CAD has remained in a steady uptrend since November 2014 and formed two well-respected upward sloping trend line in the process.
 
However, on April 13, 2015, the NZD/CAD price broke below the intermediate uptrend line and subsequent bearish momentum pushed the price to as low as 0.8810 by May 12, 2015.

After the NZD/CAD found support around the long-term uptrend line, it formed a bullish pin bar. The pin bar broke upwards on May 13 and pushed the price above the resistance zone around 0.8950. Since then, the NZD/CAD has traded within a narrow range between 0.8900 and 0.9030.

As the trade balance of New Zealand is forecasted to come down to 105 million, it may add further bearish momentum to the NZD/CAD price. However, the NZD/CAD will find two strong support just below the current range’s low, the long-term trend line and an additional psychological support level around 0.8750.

If the NZD/CAD price penetrates below the 0.8840 level, there is a high chance that the price may fall towards 0.8750. On the other hand, if the NZD/CAD price closes above the 0.9030 level, it may attract additional bullish momentum which would push the price towards the resistance around the 0.9150 level.

Under the circumstances, there are two potential trades with the NZD/CAD, base on which side of the range the price will break out.

Long Trade Setup:
Position Size Suggestion based on 2% of Equity using the Percentage Risk Model (PRM)

For Account Size: US$ 1,000, position size should be 0.25 lots (mini)
For Account Size: US$ 5,000, position size should be 1.3 lots (mini)
For Account Size: US$ 10,000, position size should be 2.5 lots (mini)

Pending Buy Stop Entry: 0.9040
Stop Loss: 0.8940
Take Profit: 0.9150

Short Trade Setup:
Position Size Suggestion based on 2% of Equity using the Percentage Risk Model (PRM)

For Account Size: US$ 1,000, position size should be 0.3 lots (mini)
For Account Size: US$ 5,000, position size should be 1.5 lots (mini)
For Account Size: US$ 10,000, position size should be 3 lots (mini)

Pending Sell Stop Entry: 0.8830
Stop Loss: 0.8910
Take Profit: 0.8750
 

AUD/NZD Reached Our Bullish Target, May Move Further Up Amid Continued Fall in the GDT Price Index


On Tuesday, at GMT 4:30 a.m., the Reserve Bank of Australia (RBA) will release the official cash rate, which is the interest rate that the financial institutions and banks in Australia charge for loans made between themselves.

Forex traders consider the official cash rate set by the RBA to be the most important factor in the valuation of the Australian Dollar against other major currencies. Most currency strategists analyze all other fundamental economic data just to predict future monetary policy and cash rate of the RBA. Hence, any unexpected change in the RBA’s cash rate can create substantial volatility in the global Forex market on Tuesday.

In May, the RBA reduced its cash rate from 2.25% to 2.00% and the forecast for June is that the RBA will keep its 2.00% cash rate unchanged.

On Tuesday, the New Zealand based Global Dairy Trade (GDT) will also release its price index, which measures the changes in the average price of dairy products sold during auctions in New Zealand.

Since the dairy industry has a large contribution to the New Zealand’s economy, any large change in the GDT price index can act as a leading indicator of the country’s trade balance with other countries. This is primarily because an increase in the price index would signal higher export income for local dairy producers.

The GDT price index is released every two weeks, and on May 19, the index reading decreased by 2.2%. Since the GDT price index has fallen since March, there is a good chance that this week’s index reading would also suggest a further decrease in the price of dairy products.

AUD/NZD Outlook

As the AUD/NZD price broke the downtrend line on April 24, we forecasted on May 4, that the pair would move as high as 1.0800. Our prediction came true on May 12.

Since reaching the 1.0840 level, the AUD/NZD found strong resistance and failed to close above this level in the last several weeks. During this time, the AUD/NZD tested this resistance level twice, and both times the attempt resulted in bearish price action that pushed the price lower.

However, on May 28, the AUD/NZD formed a bullish pin bar, which broke on Friday and pushed the price towards the psychological resistance around 1.0800 level once again.

It is worth noting that during the last downward swing, the AUD/NZD has already broken below the sharp uptrend line, which was formed after the pair broke above the long-term downtrend line on April 24. Hence, there is still a possibility of further bearish movement.

In contrast, the fundamental outlook has not changed, the GDT price index has continued to fall over the past month and the reduction in cash rate last month by the Reserve Bank of Australia should boost economic activity and help sustain the current uptrend of the AUD/NZD.

Given the mixed circumstances, the AUD/NZD price may continue to trade within a range between 1.0500 and 1.0800. However, if it penetrates above the 1.0840 level and a bullish price pattern bar appears around this level, we would once again recommend Forex traders take a long position with the AUD/NZD.

On the other hand, if the AUD/NZD price goes towards the 1.0500 level, and show any bullish price action, it may offer another opportunity to buy the pair with a better risk to reward ratio.

Hence, there are two possible buy orders for the AUD/NZD.

Long Trade Setup - 1:

Position Size Suggestion based on 2% of Equity using the Percentage Risk Model (PRM)

For Account Size: US$ 1,000, position size should be 0.3 lots (mini)
For Account Size: US$ 5,000, position size should be 1.5 lots (mini)
For Account Size: US$ 10,000, position size should be 3.0 lots (mini)

Pending Buy Stop Entry: 1.0870
Stop Loss: 1.0780
Take Profit: 1.1045

Long Trade Setup - 2:

Position Size Suggestion based on 2% of Equity using the Percentage Risk Model (PRM)

For Account Size: US$ 1,000, position size should be 0.15 lots (mini)
For Account Size: US$ 5,000, position size should be 0.75 lots (mini)
For Account Size: US$ 10,000, position size should be 1.5 lots (mini)

Pending Buy Limit Entry: 1.0520
Stop Loss: 1.0325
Take Profit: 1.0800


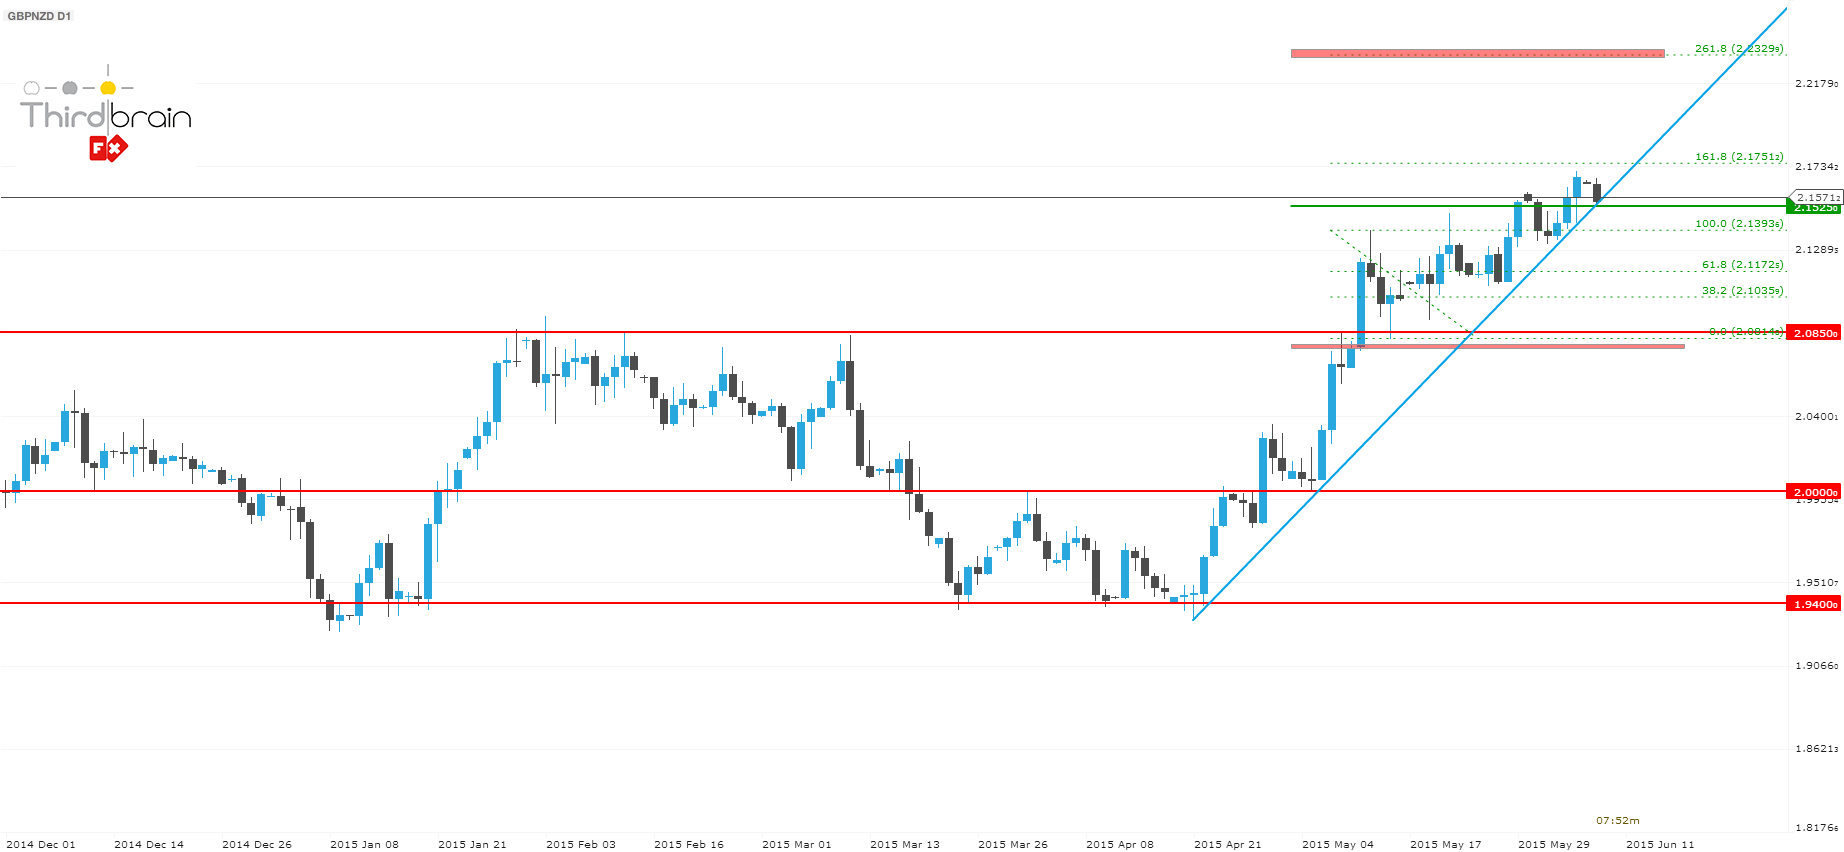
GBP/NZD is Trading Near Uptrend Line after Reaching Our Profit Target


On Wednesday, at GMT 8:30 a.m., the UK’s Office for National Statistics will release the month-over-month manufacturing production data, which measures the changes in the total value of all output produced by the manufacturing sector in the country.

Since the manufacturing sector contributes up to 80% of the total industrial production capacity in the United Kingdom, Forex traders consider the manufacturing production data to be an important fundamental indicator of the overall economy.

In May, the UK’s manufacturing production increased by 0.4% and the forecast for June is currently set at a reduced growth rate of 0.1%.

Later in the night, at GMT 9:00 p.m., the Reserve Bank of New Zealand (RBNZ) will release the official cash rate for next time period, which is the interest rate that banks and other large financial institutions in New Zealand use to lend overnight funds among themselves.

Forex traders consider the official cash rate of a country to be the most vital factor in its currency valuation against other fiat currencies. In fact, most of the currency strategists consider all other fundamental economic data in order to predict future monetary policy and overnight cash rates. Hence, a substantial change in the official cash rate in New Zealand can create unprecedented volatility in the global foreign exchange market.

For the last several months, the RBNZ has kept its official cash rate at 3.50% and the forecast for the next period is that they would leave it at 3.50% for the time being.

GBP/NZD Outlook

As we forecasted on May 19, the GBP/NZD reached our profit target around 2.1525 by May 29.  Currently, the GBP/NZD price is trading above this resistance level and the uptrend line, around 2.1550.

Given that this week, the official cash rate from RBNZ  is forecasted to remain at 3.50% and the UK’s manufacturing is set to decrease to a 0.1% growth, overall the fundamentals for this pair is neutral.

However, depending on the fundamental direction, if the actual figures come out differently, it can push the bar much higher or start a retracement. Since the GBP/NZD had been in an uptrend for the last several weeks, it would be recommended that Forex traders only consider placing long orders until the price does not close below the uptrend line.

Long Trade Setup:

Position Size Suggestion based on 2% of Equity using the Percentage Risk Model (PRM)

For Account Size: US$ 1,000, position size should be 0.17 lots (mini)
For Account Size: US$ 5,000, position size should be 0.85 lots (mini)
For Account Size: US$ 10,000, position size should be 1.7 lots (mini)

Pending Buy Stop Entry: 2.1720
Stop Loss: 2.1380
Take Profit: 2.2325


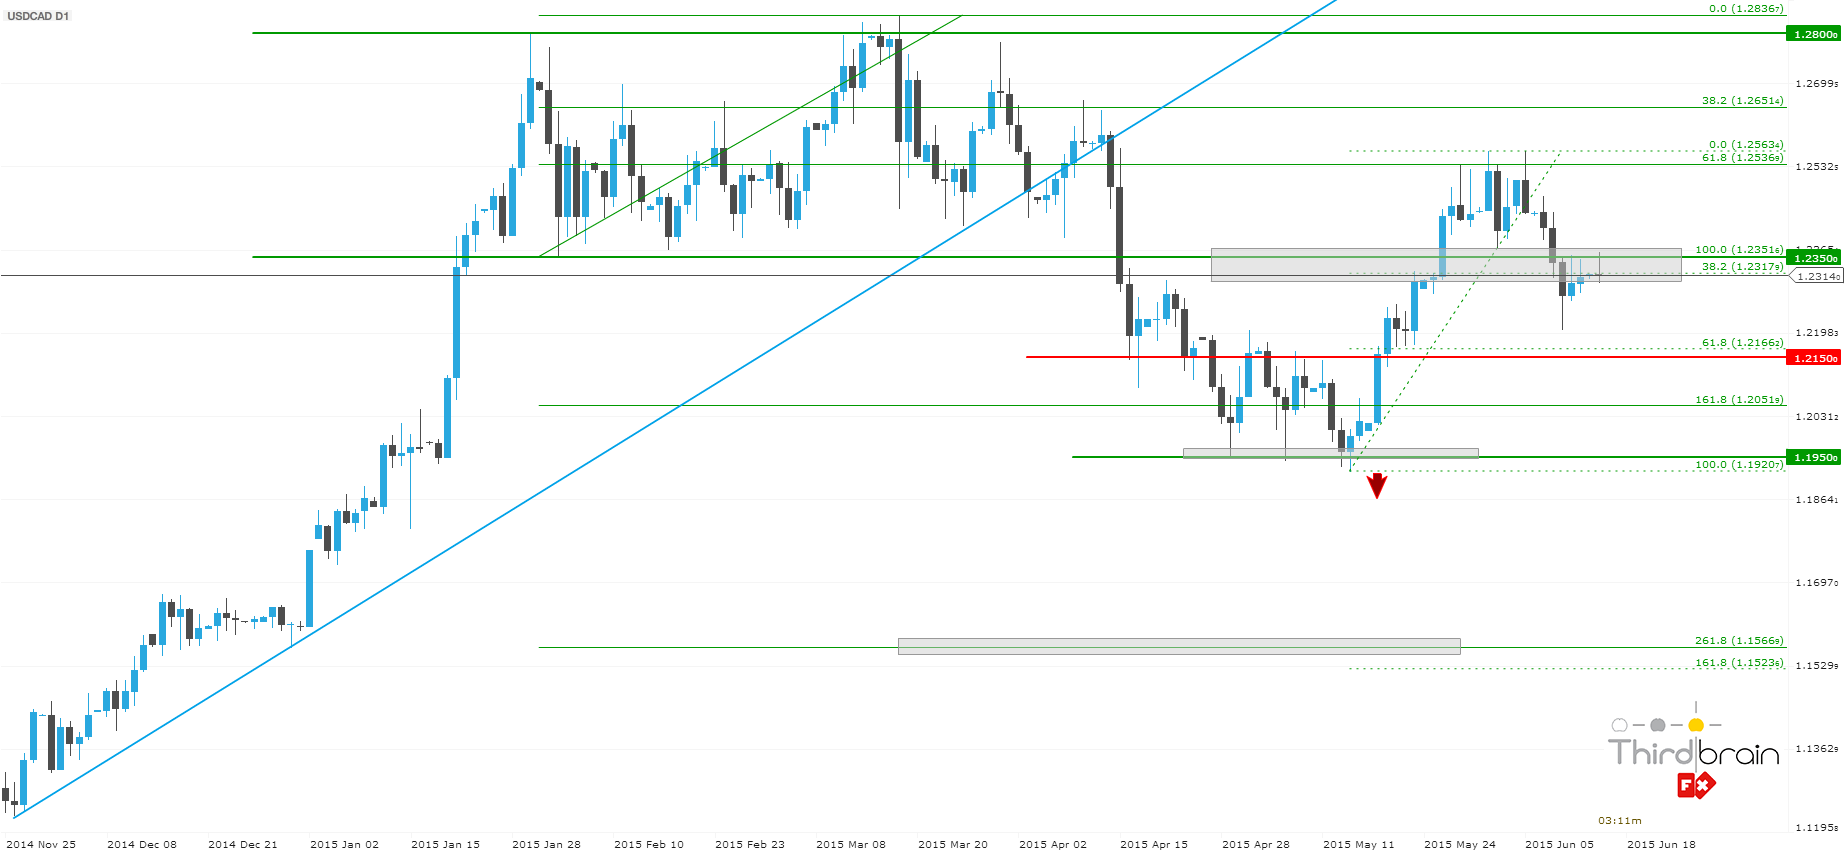
USD/CAD Appears Bearish Amid Lower than Expected Empire State Manufacturing Index Reading

At 12:30 p.m., the Statistics Canada released the month-over-month manufacturing sales data, which measures the changes in the total value of sales made by national manufacturers over the past month in Canada.

As manufacturers are the first to get affected by changing market conditions, any sudden shift in the manufacturing sales can indicate future corporate economic activity, including expenditure, job creation, and capital investments. Hence, Forex traders consider the manufacturing sales data to be an important leading indicator of the Canadian economy.

In May, the Canadian manufacturing sales (m/m) figure increased by 2.7% and the forecast for June was set at a decrease of 1.3%. However, the actual data suggested that manufacturing sales have gone down as much as 2.1% over the past month.

At 12:30 p.m., the Federal Reserve Bank of New York also released its empire state manufacturing index reading, which measures the level of a diffusion index by surveying 200 manufacturers in the state of New York.

The survey asks respondents to rate the relative level of overall business conditions in New York. Since New York’s economy has a large contribution to the overall US economy, Forex market participants consider the empire state manufacturing index for New York to be an important signal of the overall US economy.

Last month, the empire state manufacturing index reading came out at 3.1, and the forecast for June was set at 5.8. The actual index reading, however, came out way below the forecast, at negative 2.0, indicating deteriorating conditions.

USD/CAD Outlook

Since the USD/CAD broke below the long-term upward sloping trend line on April 5, the momentum had remained largely bearish. After the USD/CAD price reached the 161.8% Fibonacci extension level of the range between 1.2350 and 1.2836 in the end of April, it retraced back towards the 61.8% retracement level of this range in June.

However, the USD/CAD price formed a double top pattern on June 5, and resumed the downtrend over the last week and closed below the important resistance level around 1.2350. Today, the USD/CAD price once again was rejected around 1.2350, and currently it is trading near the 38.2% Fibonacci level of the last upward swing towards 1.2563.

As the empire state manufacturing index reading came out way lower than the forecast, the fundamental outlook for the USD/CAD is would be bearish over the next few days. Under the circumstances, if the USD/CAD price breaks below last week’s low, at 1.2200, it is likely to travel further south this week.

TRADING ADVICES

Short Trade Setup:


Money Management Advice

Position Size Suggestion based on 2% of Equity using the Percentage Risk Model (PRM)

For Account Size: US$ 1,000, position size should be 0.28 lots (mini)

For Account Size: US$ 5,000, position size should be 1.4 lots (mini)

For Account Size: US$ 10,000, position size should be 2.8 lots (mini)

Orders

Pending Sell Stop Entry: 1.2190

Stop Loss: 1.2365

Take Profit: 1.1960


Reason: