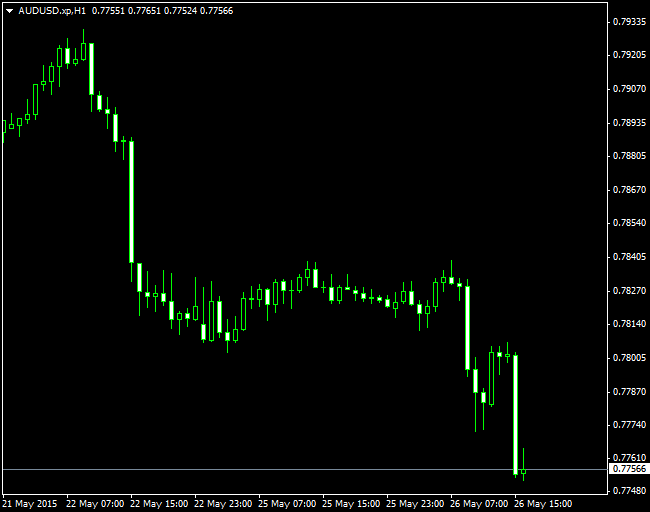
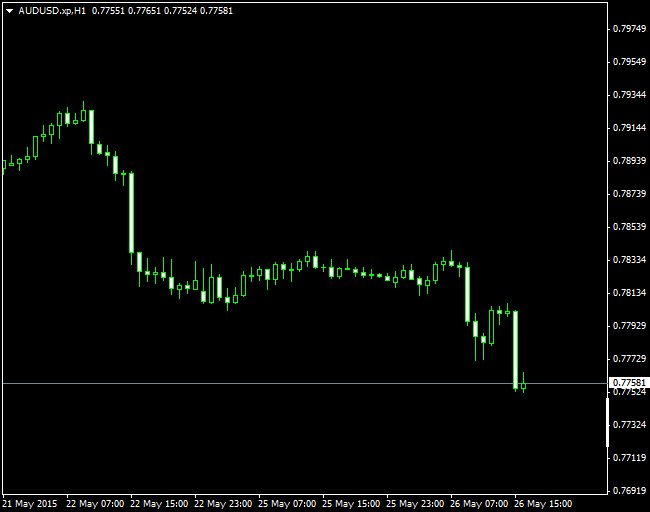
If you do what WHR said you will be able to squeeze the y axix down manually using the mouse wheel in the far right of the chart where the prices are indexed.
I know but the problem is the following:
you can only fix the scale with absolute values. For example when you fix a range between 1.3700 and 1.3800 it can work fine as long as price stays within this range. But when price breaches out and is at 1.3850 you can't see it anymore. So if you fix the scale with absolute values you always have to adjust it. And when you use the M5 timeframe it is not really applicable. For larger timeframes like D1 it may work well.
I just scroll the chart down a little bit when that happens. The alternative is not to use scale fix and let MT4 set its own vertical scale which adjusts automatically.
I opened this thread almost one year ago and now with the possibilties of the new MT4 I try my luck again.
I tested almost every ENUM_CHART_PROPERTY parameter which could add vertical space to the y-Axis but many of them are not really explained. CHART_SCALE, CHART_SCALE_PT_PER_BAR and similar things didn't work for me. Does anyone have an idea if it is possible to add some space above and below that chart to compress it a bit? But again, I don't want a fix scale. Because when changing timeframes a fix scale is useless.
Hi Mar,
Just found your post. I created this indicator a few months back to auto-scale the y-axis to show chart space above and below the current price candles/bars for my trading. Hope it is what you're after, or gives you some ideas.
(I am an amateur coder, so this code is provided "as is" and if any one is kind enough to improve or de-bug it - my thanks goes to you! It works for me currently)


//+------------------------------------------------------------------+
//|                                             Auto scale chart.mq4 |
//+------------------------------------------------------------------+
#property version   "1.00"
#property strict
#property indicator_chart_window

extern string Explanation= "chart_space is a percent of vertical axis as blank space above & below price";
extern string Inputs= "Input percent number between 0 and 49 below";
extern int chart_space= 20;
bool ChartSetInteger();
bool ChartSetDouble();
int i;

//+------------------------------------------------------------------+
//| Custom indicator initialization function                         |
//+------------------------------------------------------------------+
int OnInit()
  {
//---
   Comment("");
   if(chart_space<0 || chart_space>49)
     {
      Comment("Please enter chart_space value between 0 and 49");
      Print("Please enter chart_space value between 0 and 49");
      return(0);
     }
   ChartSetInteger(0,CHART_SCALEFIX,TRUE);
//---
   return(INIT_SUCCEEDED);
  }
//+------------------------------------------------------------------+
//| Custom indicator deinitialization function                       |
//+------------------------------------------------------------------+
int deinit()
  {
//----
   Comment("");
   ChartSetInteger(0,CHART_SCALEFIX,FALSE);
//----
   return(0);
  }
//+------------------------------------------------------------------+
//| Custom indicator iteration function                              |
//+------------------------------------------------------------------+
int OnCalculate(const int rates_total,
                const int prev_calculated,
                const datetime &time[],
                const double &open[],
                const double &high[],
                const double &low[],
                const double &close[],
                const long &tick_volume[],
                const long &volume[],
                const int &spread[])

  {
//---
   int bars_count=WindowBarsPerChart();
   int bar=WindowFirstVisibleBar();

   for( i=0; i<bars_count; i++,bar--);

   double bars_price_max=iHigh(NULL,0,iHighest(NULL,0,MODE_HIGH,bars_count,0));
   double bars_price_min=iLow(NULL,0,iLowest(NULL,0,MODE_LOW,bars_count,0));

   double chart_price_max= bars_price_max + (( bars_price_max - bars_price_min ) /(100-2*chart_space)*chart_space);
   double chart_price_min= bars_price_min - (( bars_price_max - bars_price_min ) /(100-2*chart_space)*chart_space);

   ChartSetDouble(0,CHART_FIXED_MAX,chart_price_max);
   ChartSetDouble(0,CHART_FIXED_MIN,chart_price_min);

//   Comment(bars_price_max+" "+bars_price_min);
//--- return value of prev_calculated for next call
   return(rates_total);
  }
//+------------------------------------------------------------------+
- Why use a function call
int bars_count=WindowBarsPerChart();
int bar=WindowFirstVisibleBar();

double bars_price_max=iHigh(NULL,0,iHighest(NULL,0,MODE_HIGH,bars_count,0));
double bars_price_min=iLow(NULL,0,iLowest(NULL,0,MODE_LOW,bars_count,0));
When you can just use the predefined variables?double bars_price_max=High[iHighest(NULL,0,MODE_HIGH,bars_count,0)]; double bars_price_min= Low[ iLowest(NULL,0,MODE_LOW, bars_count,0)];
- What is the purpose of
for( i=0; i<bars_count; i++,bar--);
- You assume that autoscroll is on
 and assume chart shift is off.

int bars_count=WindowBarsPerChart();
int bar=WindowFirstVisibleBar();

double bars_price_max=iHigh(NULL,0,iHighest(NULL,0,MODE_HIGH,bars_count,0));
double bars_price_min=iLow(NULL,0,iLowest(NULL,0,MODE_LOW,bars_count,0));
Don't assume, handle both.int iLeft = WindowFirstVisibleBar(); int iRight = iLeft-WindowBarsPerChart(); if(iRight < 0) iRight = 0; // Chart shifted double bars_price_max=High[iHighest(NULL,0,MODE_HIGH,iLeft-iRight+1,iRight)]; double bars_price_min= Low[ iLowest(NULL,0,MODE_LOW, iLeft-iRight+1,iRight)];
Thank-you WHRoeder!
I appreciate the comments and advice :-)
//+------------------------------------------------------------------+
//|                                             Auto scale chart.mq4 |
//+------------------------------------------------------------------+
#property version   "1.00"
#property strict
#property indicator_chart_window

extern string Explanation= "Chart Space is a percent of the vertical axis as blank space above & below price";
extern string Inputs= "Input percent number between 0 and 49 below";
extern int chart_space= 20;
bool ChartSetInteger();
bool ChartSetDouble();

//+------------------------------------------------------------------+
//| Custom indicator initialization function                         |
//+------------------------------------------------------------------+
int OnInit()
  {
//---
   Comment("");
   if(chart_space<0 || chart_space>49)
     {
      Comment("Please enter chart_space value between 0 and 49");
      Print("Please enter chart_space value between 0 and 49");
      return(0);
     }
   ChartSetInteger(0,CHART_SCALEFIX,TRUE);
//---
   return(INIT_SUCCEEDED);
  }
//+------------------------------------------------------------------+
//| Custom indicator deinitialization function                       |
//+------------------------------------------------------------------+
int deinit()
  {
//----
   Comment("");
   ChartSetInteger(0,CHART_SCALEFIX,FALSE);
//----
   return(0);
  }
//+------------------------------------------------------------------+
//| Custom indicator iteration function                              |
//+------------------------------------------------------------------+
   int OnCalculate(const int rates_total,
                const int prev_calculated,
                const datetime &time[],
                const double &open[],
                const double &high[],
                const double &low[],
                const double &close[],
                const long &tick_volume[],
                const long &volume[],
                const int &spread[])

  {
//---
   int iLeft   = WindowFirstVisibleBar();
   int iRight  = iLeft-WindowBarsPerChart();
   if(iRight < 0) iRight = 0;     // Chart shifted

   double bars_price_max=High[iHighest(NULL,0,MODE_HIGH,iLeft-iRight+1,iRight)];
   double bars_price_min= Low[ iLowest(NULL,0,MODE_LOW, iLeft-iRight+1,iRight)];

   double chart_price_max= bars_price_max + (( bars_price_max - bars_price_min ) /(100-2*chart_space)*chart_space);
   double chart_price_min= bars_price_min - (( bars_price_max - bars_price_min ) /(100-2*chart_space)*chart_space);

   ChartSetDouble(0,CHART_FIXED_MAX,chart_price_max);
   ChartSetDouble(0,CHART_FIXED_MIN,chart_price_min);

//--- return value of prev_calculated for next call
   return(rates_total);
  }
//+------------------------------------------------------------------+
Thank-you WHRoeder!
I appreciate the comments and advice :-)
Hi Forum,
I think most of you know that problem: You see a very big and choppy range in the chart window and after a successful breakout this terribly looking range becomes tiny and tradeable. Usually I compress the y-axis a little bit. That makes a choppy chart appearing less "dangerous".
Is there any possibility to auto-compress the y-axis? The only possibilty I know is to add a large indicator window. Maybe it is possible to compress the chart by some Win32/64 dll-functions?
Thank-you WHRoeder!
I appreciate the comments and advice :-)
Hi Forum
Just tested this indi which looks quite interesting. I'm actually searching a solution to replace the right scale price values
by BRN values. Actually I'm using below Sweet Spot indicator for this however the BRN values are not very well visible and
they interfere in between the messy price values of MT4. (see encl. pic)
> Does anyone know a solution to just completely supress the MT4 price values?
(instead of selecting a darker foreground color)
> or could this be solved combining above Auto Scale Chart indi and the Sweet Spot indi?
> or would it be possible to have the price values written in a specific color i.e. white instead of having them in clear
on the Sweet Spot indi? (keeping the lines dark)
Apreciate your help:-)
kayak
//+------------------------------------------------------------------+
//| SweetSpots.mq4 |
//| |
//| |
//+------------------------------------------------------------------+
#property copyright "Copyright Shimodax"
#property link "http://www.strategybuilderfx.com"
#property indicator_chart_window
extern int LinesAboveBelow= 10;
extern color LineColorMain= DarkOliveGreen;
extern color LineColorSub= DarkOliveGreen;
double dPt;
//+------------------------------------------------------------------+
//| Custom indicator initialization function |
//+------------------------------------------------------------------+
int init()
{
dPt = Point;
if(Digits==3||Digits==5){
dPt=dPt*10;
}
return(0);
}
int deinit()
{
int obj_total= ObjectsTotal();
for (int i= obj_total; i>=0; i--) {
string name= ObjectName(i);
if (StringSubstr(name,0,11)=="BRN")
ObjectDelete(name);
}
return(0);
}
//+------------------------------------------------------------------+
//| Custom indicator iteration function |
//+------------------------------------------------------------------+
int start()
{
static datetime timelastupdate= 0;
static datetime lasttimeframe= 0;
// no need to update these buggers too often
if (CurTime()-timelastupdate < 600 && Period()==lasttimeframe)
return (0);
int i, ssp1, style, ssp;
double ds1;
color linecolor;
ssp1= Bid / dPt;
ssp1= ssp1 - ssp1%50;
for (i= -LinesAboveBelow; i<LinesAboveBelow; i++) {
ssp= ssp1+(i*50);
if (ssp%100==0) {
style= STYLE_SOLID;
linecolor= LineColorMain;
}
else {
style= STYLE_DOT;
linecolor= LineColorSub;
}
ds1= ssp*dPt;
SetLevel(DoubleToStr(ds1,Digits), ds1, linecolor, style, Time[10]);
}
return(0);
}
//+------------------------------------------------------------------+
//| Helper |
//+------------------------------------------------------------------+
void SetLevel(string text, double level, color col1, int linestyle, datetime startofday)
{
int digits= Digits;
string linename= "[SweetSpot] " + text + " Line",
pricelabel;
// create or move the horizontal line
if (ObjectFind(linename) != 0) {
ObjectCreate(linename, OBJ_HLINE, 0, 0, level);
ObjectSet(linename, OBJPROP_STYLE, linestyle);
ObjectSet(linename, OBJPROP_COLOR, col1);
ObjectSet(linename, OBJPROP_WIDTH, 0);
}
else {
ObjectMove(linename, 0, Time[0], level);
}
}
- Free trading apps
- Over 8,000 signals for copying
- Economic news for exploring financial markets
You agree to website policy and terms of use
Hi Forum,
I think most of you know that problem: You see a very big and choppy range in the chart window and after a successful breakout this terribly looking range becomes tiny and tradeable. Usually I compress the y-axis a little bit. That makes a choppy chart appearing less "dangerous".
Is there any possibility to auto-compress the y-axis? The only possibilty I know is to add a large indicator window. Maybe it is possible to compress the chart by some Win32/64 dll-functions?