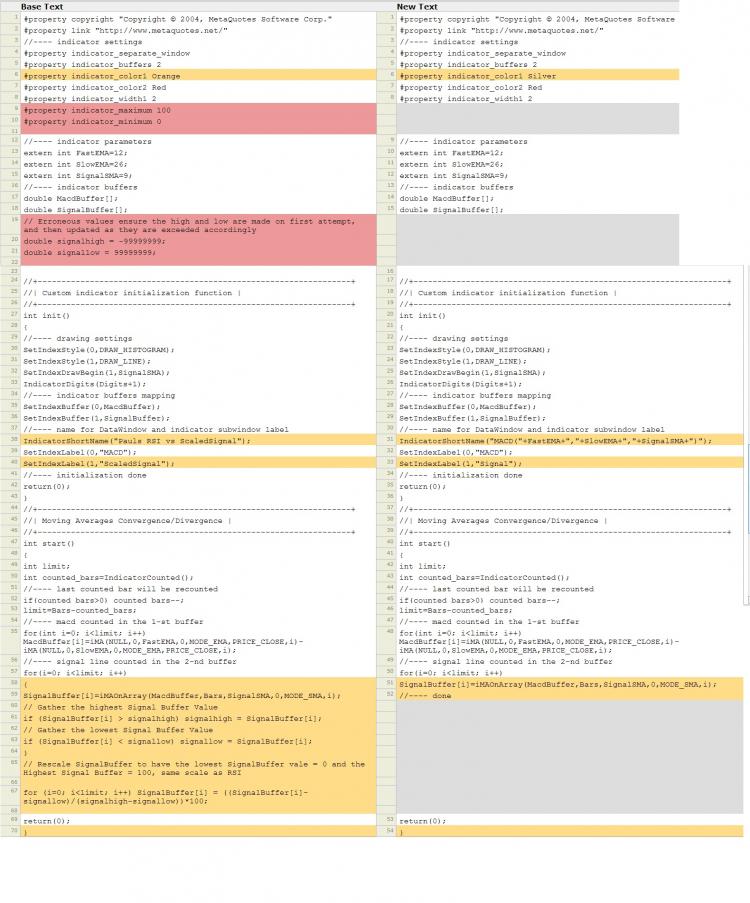
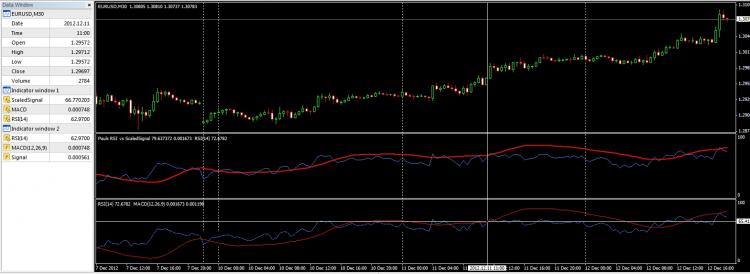
The bottom window is the RSI(14) with a MACD(12,26,9) Signal line drag and dropped in on MT4. The middle window is a result of the linear scaling I performed on the MACD (close, but no cigar) - Please Help! I attached side by side code compares for a simple macd conversion. To clarify, I want to be able to replicate what MT4 does when I drag any Oscillator / MACD / etc onto a fixed scale graph, so that I can trade points I am visually seeing automatically.
#property  copyright "Copyright © 2004, MetaQuotes Software Corp."
#property  link      "http://www.metaquotes.net/"
//---- indicator settings
#property  indicator_separate_window
#property  indicator_buffers 2
#property  indicator_color1  Orange
#property  indicator_color2  Red
#property  indicator_width1  2
#property indicator_maximum 100
#property indicator_minimum 0

//---- indicator parameters
extern int FastEMA=12;
extern int SlowEMA=26;
extern int SignalSMA=9;
//---- indicator buffers
double     MacdBuffer[];
double     SignalBuffer[];
// Erroneous values ensure the high and low are made on first attempt, and then updated as they are exceeded accordingly
double signalhigh = -99999999;
double signallow = 99999999;


//+------------------------------------------------------------------+
//| Custom indicator initialization function                         |
//+------------------------------------------------------------------+
int init()
  {
//---- drawing settings
   SetIndexStyle(0,DRAW_HISTOGRAM);
   SetIndexStyle(1,DRAW_LINE);
   SetIndexDrawBegin(1,SignalSMA);
   IndicatorDigits(Digits+1);
//---- indicator buffers mapping
   SetIndexBuffer(0,MacdBuffer);
   SetIndexBuffer(1,SignalBuffer);
//---- name for DataWindow and indicator subwindow label
   IndicatorShortName("Pauls RSI vs ScaledSignal");
   SetIndexLabel(0,"MACD");
   SetIndexLabel(1,"ScaledSignal");
//---- initialization done
   return(0);
  }
//+------------------------------------------------------------------+
//| Moving Averages Convergence/Divergence                           |
//+------------------------------------------------------------------+
int start()
  {
   int limit;
   int counted_bars=IndicatorCounted();
//---- last counted bar will be recounted
   if(counted_bars>0) counted_bars--;
   limit=Bars-counted_bars;
//---- macd counted in the 1-st buffer
   for(int i=0; i<limit; i++) MacdBuffer[i]=iMA(NULL,0,FastEMA,0,MODE_EMA,PRICE_CLOSE,i)-iMA(NULL,0,SlowEMA,0,MODE_EMA,PRICE_CLOSE,i);

//---- signal line counted in the 2-nd buffer
   for(i=0; i<limit; i++)
   {
     SignalBuffer[i]=iMAOnArray(MacdBuffer,Bars,SignalSMA,0,MODE_SMA,i);
//    Gather the highest Signal Buffer Value
      if (SignalBuffer[i] > signalhigh) signalhigh = SignalBuffer[i];
//    Gather the lowest Signal Buffer Value
      if (SignalBuffer[i] < signallow) signallow = SignalBuffer[i];
   }
// Rescale SignalBuffer to have the lowest SignalBuffer vale = 0 and the Highest Signal Buffer = 100, same scale as RSI

   for (i=0; i<limit; i++)
   {
   SignalBuffer[i] = (SignalBuffer[i]-signallow)/(signalhigh-signallow)*100;

   }
   return(0);
}
Even if you try to put MACD level zero in RSI level 50, it won't makes any sense, because MACD has no tops nor bottoms.
And please show the code using SRC button
So my exact question is, what is MT4 doing when I drag that MACD on top of RSI, because I want to trade on the visual crossings I see there, so I want to recreate those crossings mathematically. Understood the way I am doing it is not correct.
Also sorry for my previous comment, I was fast read your topic. However my comment did gave me idea, though I don't know if its solve your problem.
Use iRSIOnArray() (https://docs.mql4.com/indicators/iRSIOnArray) and create RSI by using MACD data.
Also sorry for my previous comment, I was fast read your topic. However my comment did gave me idea, though I don't know if its solve your problem.
Use iRSIOnArray() (https://docs.mql4.com/indicators/iRSIOnArray) and create RSI by using MACD data.
So my preference is to maintain the RSI as is on the 0-100 scale, and understand how MT4 "scales" the MACD data to fit onto that 0-100 graph, so I can reproduce that calculation. I believe using IRSIOnArray is not going to give me the standard RSI(14) data which I am looking for (also it will not give me the ability to understand how MT4 "rescales", I have more indicators I have "visually" verified I want to use, however I am unable to automate their trading due to mathematical inconsitencies....MT4 is consistent in how it places the MACD on the 0-100 RSI scale, I just need to figure out how, or hopefully have someone from MT4 provide the answer without reverse engineering.
So my preference is to maintain the RSI as is on the 0-100 scale, and understand how MT4 "scales" the MACD data to fit onto that 0-100 graph, so I can reproduce that calculation. I believe using IRSIOnArray is not going to give me the standard RSI(14) data which I am looking for (also it will not give me the ability to understand how MT4 "rescales", I have more indicators I have "visually" verified I want to use, however I am unable to automate their trading due to mathematical inconsitencies....MT4 is consistent in how it places the MACD on the 0-100 RSI scale, I just need to figure out how, or hopefully have someone from MT4 provide the answer without reverse engineering.
Nope MT is NOT consistent when placing MACD on RSI - just scroll down to historical data, and you will see the value of MACD will go up and down through levels of RSI.
Al right I made error again with my previous idea ;D.
Here's the correct one : MACD is a result of fast MA subtracted by Slow MA. We can attach 2 MAs with different period on a chart, and if we divide them by 2 we have the MACD result on chart.
MACD_on_chart = (Fast MA + Slow MA)/ 2To make it "synch" with standard RSI, use RSI calculation instead iRSIOnArray (RSI under Custom Indicator in MetaEditor) and calculate that "MACD result on chart" against the slow MACD.
Just attach the MAs and think about it.
Nope MT is NOT consistent when placing MACD on RSI - just scroll down to historical data, and you will see the value of MACD will go up and down through levels of RSI.
Al right I made error again with my previous idea ;D.
Here's the correct one : MACD is a result of fast MA subtracted by Slow MA. We can attach 2 MAs with different period on a chart, and if we divide them by 2 we have the MACD result on chart.
To make it "synch" with standard RSI, use RSI calculation instead iRSIOnArray (RSI under Custom Indicator in MetaEditor) and calculate that "MACD result on chart" against the slow MACD.
Just attach the MAs and think about it.
I agree it is not consistent with RSI, however it is consistent with zero crossing at 50. And I am more interested in how MT4 takes the data from two different "scales" and drops them on one, as I have several other indicators I need to match EXACTLY to the visual I am seeing for a client who wants to automate his system exactly as the visuals he has manually traded his system to. I assumed I could take the min / max of the signal - divide by 2, and that would be my "50" or zero crossing. Even then I do not see how to create what MT4 automatically does.
Again, I am looking for the exact way MT4 imports MACD/Oscillator/Williams/etc on top of each other, so i can reproduce that data programatically to match the visual information on the indicator chart. The RSI/MACD is irrelevant, just an example in this case. I have many indicators I need to match mathematically, and I am struggling to understand the methodology of MT4's application. I have spoken to the Cyprus office, and they have said they will attempt to support via this thread. however if someone from MT4 would like to speak 1:1, please reach out, as this is a massive project several clients wanting to invest a lot of capital once their manual system has proven to be able to automate.
Hope your client reading this too.
That windows programming you asking.
Here's maybe the solution : Add 2 buffers in MACD which draw none, search the high and the low using WindowsBarPerChart() and WindowsFirstVisibleBar(), and hopefully you get what you looking for.
Hope your client reading this too.
That windows programming you asking.
Here's maybe the solution : Add 2 buffers in MACD which draw none, search the high and the low using WindowsBarPerChart() and WindowsFirstVisibleBar(), and hopefully you get what you looking for.
I think my point is still misunderstood. I am trying to understand what code MT4 uses to place two different scaled items on one graph visually.
- Free trading apps
- Over 8,000 signals for copying
- Economic news for exploring financial markets
You agree to website policy and terms of use


I am attempting to use several indicators such as macd, oscillator, etc against other indicators that have hard ranges, such as rsi and have automated trading based on their crossing points (currently only seen visually)
When I start a standard RSI(14) indicator window, and drag a standard MACD Signal Line(12,26,9) onto it, MT4 "rescales, adjusts, reformats" the MACD signal line onto the RSI line. I want to be able to identify these crossing points even though they are totally different #'s. My first thought was to take the MACD signal line and rescale it linearly on a 0-100 scale
Scaled Value = (A-B) * (E-D) / (B-C) + D
Where:
A = Value requiring scaling (Current MACD Signal or vMACD)
B = From Minimum (MinMACD Signal) (some value around -.0xx)
C = From Maximum (MaxMACD Signal) (some value around +.0xx)
D = To Minimum (RSI = 0)
E = To Maximum (RSI = 100)
Therefore, due to min=0 the equation becomes ((vMACD - MinMACD) * 100)/(MinMACD - MaxMACD)
Where (MinMACD-MaxMACD) = Range of MACD values and 0-100 is the new scale.
As you can see from the attached screenshots, my re-scaling is close, however not exact (which is a requirement for my client) - this is just an example of several indicators that have been combined and visually traded on, but the desire is to automate this trading.
My exact question is when I have an indicator with a fixed range window (0-100, -100-0, etc) and I drag an indicator such as MACD with a moving range, what function/calculation does Metatrader perform to overlay the graphs so I can logically recreate these crossing points in automated trading in my MQL4 code?
I want to automate trading based off of the VISUAL I am seeing in the bottom indicator window (which is just MACD dragged onto RSI), so I need the ACTUAL VALUE numbers to match in my code. (i.e. in the visual the crossing pt may be RSI=68.7 and the MACD Signal may be .00062) I want my code to be able to match that exact same crossing pt so that I have numerically RSI = 68.8 and MACD Signal = 68.7 (Or if I am overcomplicating this, tell me that too!)