The scale on your chart for the NIFY goes from 4815.70 to 5060.50 . . . how do you expect to see anything with a value of 77.197 on this chart ?
RaptorUK:
The scale on your chart for the NIFY goes from 4815.70 to 5060.50 . . . how do you expect to see anything with a value of 77.197 on this chart ?
The scale on your chart for the NIFY goes from 4815.70 to 5060.50 . . . how do you expect to see anything with a value of 77.197 on this chart ?
If you have ever used any Stochastic then most of them have upper limit of 100 and lower limit of 0 so that data windows is showing value of Indicator where my cursor is in the image.
Over all idea is I wanted to get stochastic indicator on the chart not on separate windows.,.,. could you please help me out????
I don't use Technical Indicators . . . you could scale the values to give you a purely visual representation . . .
RaptorUK:
I don't use Technical Indicators . . . you could scale the values to give you a purely visual representation . . .
I don't use Technical Indicators . . . you could scale the values to give you a purely visual representation . . .
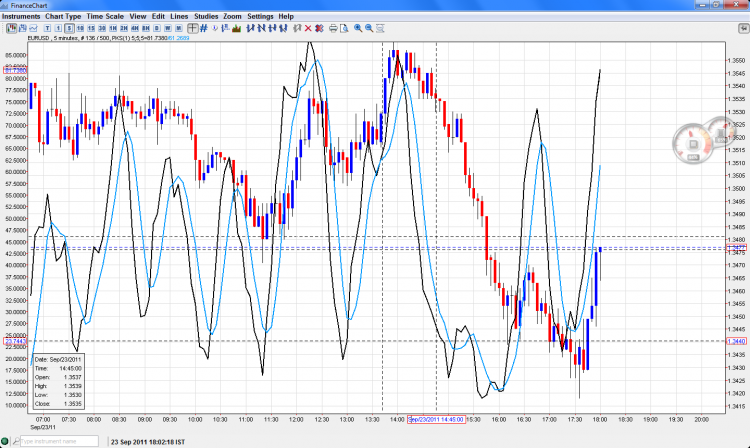
I have seen this indicator on netdania.com
below is the image for your reference
Is that possible to correct the coding which Ihave used to create my indicator?
in my 1st image the value of this indicator 0-100 shows in data windows but the problem is lines like above image are not showing up in my indicator!!!!
TerryTosan:
Yes, that chart has a 2nd Y axis on the left hand side . . MT4 doesn't have this facility.
I have seen this indicator on netdania.com
TerryTosan:
Over all idea is I wanted to get stochastic indicator on the chart not on separate windows
Since MT4 doesn't have overlay windows you can scale the output to the chart but the actual values will not be useful.Over all idea is I wanted to get stochastic indicator on the chart not on separate windows
double  indicator(int iBar){    return ( iStochastic(..., iBar) );  }
int start(){
    // Visible portion of the screen
    int     iLeft           = WindowFirstVisibleBar(),
            iRight          = iLeft - WindowBarsPerChart();
    if (iRight<0)    iRight = 0;  // Tester/Chart Shift
    double  chart.top       = WindowPriceMax(),
            chart.bottom    = WindowPriceMin(),
            chart.range     = chart.top-chart.bottom;
    /*++++ Adjust if Desired.*/{
    chart.top  -= chart.range*0.05;     chart.bottom += chart.range*0.05;
    chart.range = chart.top-chart.bottom;
    /*---- Adjust if Desired.*/}

    /*++++ option one scale actual indicator limits to the screen{
    #define INF 0x6FFFFFFF  // Not quite infinite, Jul 2029, or 1,879,048,191
    double  indicator.max   = 0,
            indicator.min   = INF;
    for (int iBar = iLeft; iBar >= iRight; iBar--){ // Indicator's real min/max.
        double value = indicator(iBar);
        if (indicator.max < value) indicator.max = value;
        if (indicator.min > value) indicator.min = value;
    }
    /*---- option one scale actual indicator to the screen*/}
    /*++++ option two scale indicator limits to the screen*/{
    double  indicator.max =   0,                    // Indicator's real limits.
            indicator.min = 100;
    /*---- option two scale indicator limits to the screen*/}
    double  indicator.range = indicator.max - indicator.min;
    if (indicator.range == 0.0) indicator.range = 1.0;

    // Draw indicator as a main overlay
    for (iBar = iLeft; iBar >= iRight; iBar--){
        double  value       = indicator(iBar),
                scaled_0_1  = (value - indicator.min) / indicator.range;
        ValueOnChart[iBar]  = scaled_0_1 * chart.range + chart.bottom;
    }
You are missing trading opportunities:
- Free trading apps
- Over 8,000 signals for copying
- Economic news for exploring financial markets
Registration
Log in
You agree to website policy and terms of use
If you do not have an account, please register

Hello there,
I am just trying to create my own indicator, Idea for the indicator is I wanted to see Stochastic on my charts instead of separate window.
For that I create indicator and attaching the code of it.
Now the problem is whenever I insert indicator in chart nothing appear but the values of that "On Screen Stochastic"* data window is showing in data window.
here is the image of my problem
I was not the student of IT so not that much in coding what I can do is just copy paste.
If any one already this On Screen Stochastic then please share that indicator with me
OR
Help me out with coding to that stochastic lines can appear in in the same chart window.
thanks,
Terry