Tick volume histogram in chart window

 
#property indicator_indicator_window
#property indicator_buffers 2
#property indicator_color1 Green
#property indicator_color2 Red
//---- buffers
extern int MaxDrawBars=2000;
double ExtMapBuffer1[];
double ExtMapBuffer2[];
int myBars;
int tickCounter;
int delimeterCounter;

double CurrentTick;
double PreviousTick;
//+------------------------------------------------------------------+
//| Custom indicator initialization function                         |
//+------------------------------------------------------------------+
int init()
  {
//---- indicators
   SetIndexStyle(0,DRAW_HISTOGRAM);
   SetIndexBuffer(0, ExtMapBuffer1);
   SetIndexEmptyValue(0,0.0);

   for (int i=Bars-1;i>=0;i--) ExtMapBuffer1[i]=0.0;
   
   
   SetIndexStyle(1,DRAW_HISTOGRAM);
   SetIndexBuffer(1, ExtMapBuffer2);
   SetIndexEmptyValue(1,0.0);

   for (i=Bars-1;i>=0;i--) ExtMapBuffer2[i]=0.0;
//----
   return(0);
  }
//+------------------------------------------------------------------+
//| Custom indicator deinitialization function                       |
//+------------------------------------------------------------------+
int deinit()
  {
//----
   
//----
   return(0);
  }
//+------------------------------------------------------------------+
//| ??????? ??????                                                   |
//+------------------------------------------------------------------+

//+------------------------------------------------------------------+
//| ??????? ??????                                                   |
//+------------------------------------------------------------------+

//+------------------------------------------------------------------+
//| ??????? ?????? ????                                              |
//+------------------------------------------------------------------+

//+------------------------------------------------------------------+
//| Custom indicator iteration function                              |
//+------------------------------------------------------------------+
int start()
  {
   int    counted_bars=IndicatorCounted();
   
      PreviousTick = CurrentTick;
      CurrentTick = Bid;
         
//----

if(myBars != Bars) {
      ExtMapBuffer1[0] = 0;
      ExtMapBuffer2[0] = 0;
      if(CurrentTick > PreviousTick) ExtMapBuffer1[0]++;
      if(CurrentTick < PreviousTick) ExtMapBuffer2[0] = ExtMapBuffer2[0] - 1;
      myBars = Bars;
      }
      else
      {
      if(CurrentTick > PreviousTick) ExtMapBuffer1[0]++;
      if(CurrentTick < PreviousTick) ExtMapBuffer2[0] = ExtMapBuffer2[0] - 1;
      }
      

   return(0);
  }
//+------------------------------------------------------------------+
This is code for a tick volume histogram. It seperates the up ticks and down ticks and paints them green and red repsectivley. I am trying to mod it so it shows up in the chart window like a bar chart and I would like each "tick bar" to open at the new open of a bar. I hope that makes sense. I changed it to #property indicator_chart_window but obviously with the values set to 0 it paints the bars the whole height of the chart. Any help would be very much appreciated, thankyou, MW
 
You need 2 buffers per bar type, one buffer for the start price of the bar, the second is for the end price of the bar.
 

Is there anyone who could provide their coding skills as mine are pretty limited, I've got as far as it opening at the open of a new bar, but it is not keeping the down ticks red bar, it keeps disappearing, It would be very much appreciated, thankyou.
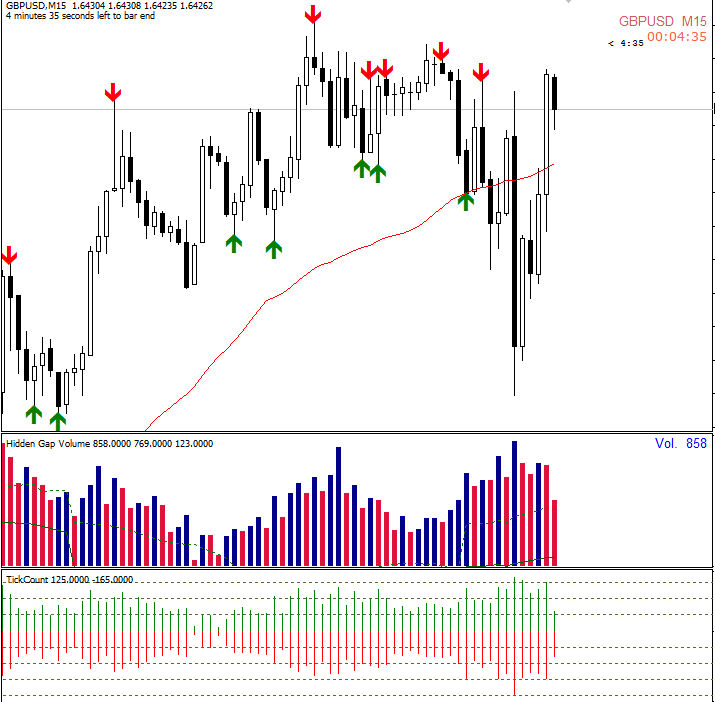

I would like this histogram at the bottom here to be painted in the chart window as a kind of bar chart, without the actual OHLC bars visible so they dont interfere with the tick bars, and have them start at the open of a new bar, I hope I have made it clear enough, and thankyou again in advance for any help.

 
I dont mean to keep going on but I desperatly need this histogram displayed in the chart window, so if anyone can modify the above code I am willing to pay them for their services
 
mattkw174:

I would like this histogram at the bottom here to be painted in the chart window as a kind of bar chart,


You mean the TickCount chart ? what is it's scale (y axis) ? if it's not the same as the main chart you won't see it . . will you ?
 

Hi Raptor, TickCount seperates the up ticks and the down ticks on the bid price and displays them on the histogram. What I would like is to have it displayed as a bar chart in the chart window. The ticks obviously start at 0, so when its in the chart window it starts counting from 0 and goes up in increments of 1. I have fiddled around with the code and managed to anchor the start of the tick bars to the bid price, but I cant seem to get it to go up in increments of a smaller size and also, because it is anchored to the bid each increment starts from the current bid price and doesnt stay at the open price of the new bar like it does at 0 on the histogram. I fear what I have just said is as clear as mud. Im hoping it is possible to code and as I said before I am willing to pay for it. I hope that answers any questions you have and if it is at all possible, Thankyou for your reply.

MW

 
I compiled your indicator and understand more about what you want now . . . anchoring the bars at the current bar open is easy . . the scaling is more problematic. If you start the Indicator when the bars are small and the the bars get bigger the Tick Bars will be too big and visa versa. They could be dynamically re-scaled but that would reduce accuracy as the older bars (those bars already drawn) were re-scaled more and more.
 
RaptorUK:
I compiled your indicator and understand more about what you want now . . . anchoring the bars at the current bar open is easy . . the scaling is more problematic. If you start the Indicator when the bars are small and the the bars get bigger the Tick Bars will be too big and visa versa. They could be dynamically re-scaled but that would reduce accuracy as the older bars (those bars already drawn) were re-scaled more and more.

Thanks for your help Raptor, Could you make the increments of the tick bars 1 tenth of a pip like OHLC bars, I dont care what the actual price is cause I dont need it for what I want to test. I know what I want it to look like, just having a hard time conveying it to you :-)
 
mattkw174:

Thanks for your help Raptor, Could you make the increments of the tick bars 1 tenth of a pip like OHLC bars, I dont care what the actual price is cause I dont need it for what I want to test. I know what I want it to look like, just having a hard time conveying it to you :-)
Of course you can, that isn't difficult, but if the scaling is too small you won't see much and if it's too big the bars will be off the chart.
 
RaptorUK:
Of course you can, that isn't difficult, but if the scaling is too small you won't see much and if it's too big the bars will be off the chart.

Could you have a crack at it ? I would appreciate it so much.
 
mattkw174:

Could you have a crack at it ? I would appreciate it so much.
You think I have nothing better to do ?
Reason: