Hello MQL Team,
exists a tool, which shows a Chart from Date to Date.
For example:
I will show a Chart from 01.01.2009 to 31.12.2009 in a D1, H4, H1, 30min timeframe. Is that possible ? Than i will the the actually Chart overlay this Chart from 2009.
Exists this tool or it is possible that you create this tool ?
Kind Regards
Balduin
If I understand you right you can make it with rectangle.
Just draw rectangle with your favorite color in the date range you are interested in and zoom in and out. Rectangle will aways cover your date range.
HTH,
--
Luke
ChartsAccess.com - metatrader charts in any phone.
If I understand you right you can make it with rectangle.
Just draw rectangle with your favorite color in the date range you are interested in and zoom in and out. Rectangle will aways cover your date range.
HTH,
--
Luke
ChartsAccess.com - metatrader charts in any phone.
Hello Luke,
that recatangle helps.
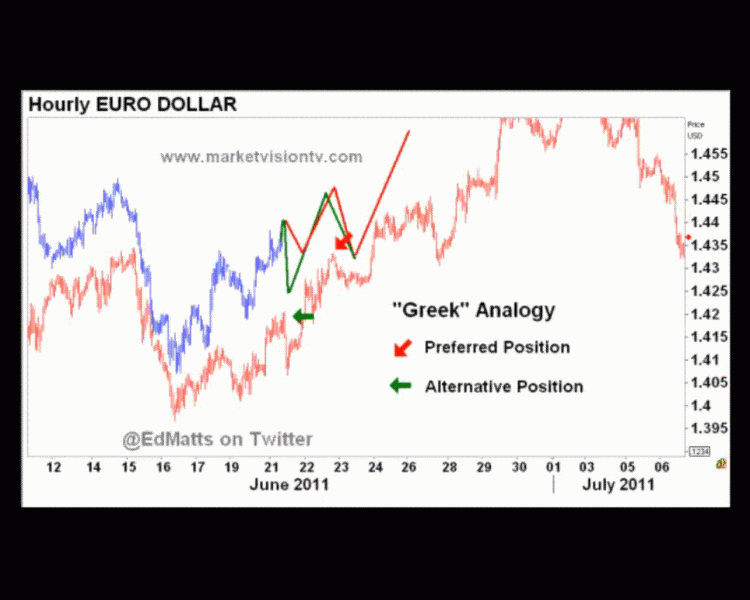
The image shows the overlay Chart, that i find usefull. The idea is from Mr. Matts, Marketvision Tv, my question, could you create an Indicator, that makes this posssible ?
For example:
You see a Chart from the past and overlay the actually Chart and you can compare it. It is a mask or template.
Kind Regards
Balduin

I'm trying hard but I don't understand what you want done :) Screenshot or something?
As I understand it you want to show only part of your chart ( in a specific time interval) and in any timeframe. True?
Got owned by a ninja post before me.
I'm trying hard but I don't understand what you want done :) Screenshot or something?
As I understand it you want to show only part of your chart ( in a specific time interval) and in any timeframe. True?
Got owned by a ninja post before me.
Hello forexcoder,
you missunderstood me.
The sreenshot shows the Eur/usd Chart. You see the past in red and the actually price actiion in blue. You scroll the price acion chart (blue) until, it is identy to the red chart.
The Idea is: to trade the Analogy.
Can you this create for the metatrader community ?
Kind Regards
balduin
See also Buttons & Textfields on mt4 chart possible now - MQL4 forum as for the shifting
- Free trading apps
- Over 8,000 signals for copying
- Economic news for exploring financial markets
You agree to website policy and terms of use
Hello MQL Team,
exists a tool, which shows a Chart from Date to Date.
For example:
I will show a Chart from 01.01.2009 to 31.12.2009 in a D1, H4, H1, 30min timeframe. Is that possible ? Than i will the the actually Chart overlay this Chart from 2009.
Exists this tool or it is possible that you create this tool ?
Kind Regards
Balduin