How to modify overlay chart from candle stick to line chart?


How to modify overlay chart from candle stick to line chart?

It is quite difficult to see in candlestick?

Can i convert the overlay chart to display line chart instead?

Thanks

//+------------------------------------------------------------------+
//|                                       OverLay Chart.mq4 Ver.1.10 |
//|                                      Copyright?2006-2007 S.B.T. |
//|                                     http://sufx.core.t3-ism.net/ |
//+------------------- DO NOT REMOVE THIS HEADER --------------------+
//|  This script is free to use/distribute/modify and re-distribute. |
//|                                  (Limited to noncommercial use.) |
//+------------------------------------------------------------------+

//Indicator Properties
#property copyright "Copyright?2006 S.B.T."
#property link      "http://sufx.core.t3-ism.net/"
#property indicator_chart_window
#property indicator_buffers 4


//Indicator Parameters
extern string SubSymbol = "GBPUSD";
extern color BullBarColor = MediumSeaGreen;
extern color BearBarColor = Orange;
extern color GridColor = Black;
extern bool Mirroring = false;

//Global Variables
string Prefix; //Indicator Prefix
int Grid = 10; //Grid Lines
int SnapPips = 10;  //Snap Pips For Grid Lines


//Indicator Buffers
double ExtMapBuffer1[];
double ExtMapBuffer2[];
double ExtMapBuffer3[];
double ExtMapBuffer4[];


//+------------------------------------------------------------------+
//| Custom indicator initialization function                         |
//+------------------------------------------------------------------+
int init() {

   //Initialize Indexes
   Prefix = "OverLayChart" + SubSymbol;

   IndicatorShortName( "OverLay Chart( " + SubSymbol + " )" );

   SetIndexBuffer( 0, ExtMapBuffer1 );
   SetIndexBuffer( 1, ExtMapBuffer2 );
   SetIndexBuffer( 2, ExtMapBuffer3 );
   SetIndexBuffer( 3, ExtMapBuffer4 );

   SetIndexStyle( 0, DRAW_HISTOGRAM, DRAW_LINE, 1, BullBarColor );
   SetIndexStyle( 1, DRAW_HISTOGRAM, DRAW_LINE, 1, BearBarColor );
   SetIndexStyle ( 2, DRAW_HISTOGRAM, DRAW_LINE, 3, BullBarColor );
   SetIndexStyle( 3, DRAW_HISTOGRAM, DRAW_LINE, 3, BearBarColor );

   SetIndexEmptyValue( 0, 0.0 );
   SetIndexEmptyValue( 1, 0.0 );
   SetIndexEmptyValue( 2, 0.0 );
   SetIndexEmptyValue( 3, 0.0 );


   return( 0 );
}


//+------------------------------------------------------------------+
//| Custom indicator deinitialization function                       |
//+------------------------------------------------------------------+
int deinit() {
   int _i;


   //Delete Objects
        ObjectDelete( Prefix + "Status" );
        ObjectDelete( Prefix + "Copyright" );

        for ( _i = 1; _i <= Grid ; _i ++ ) {
        ObjectDelete( Prefix + "Grid" + _i );
        ObjectDelete( Prefix + "Price" + _i );
   }


   return( 0 );
}


//+------------------------------------------------------------------+
//| Custom indicator iteration function                              |
//+------------------------------------------------------------------+
int start() {
   int _BarsCount;
   double _CurRangeHigh, _CurRangeLow, _CurRangeCenter;
   double _SubRangeHigh, _SubRangeLow, _SubRangeCenter;
   double _SubPoint, _SubDigit;
   double _SubOpen, _SubHigh, _SubLow, _SubClose;
   double _PipsRatio;
   double _GridPips, _GridPrice;
   int _i;


   //Initialize Buffers
        RefreshRates();

   ArrayInitialize( ExtMapBuffer1, 0.0 );
   ArrayInitialize( ExtMapBuffer2, 0.0 );
   ArrayInitialize( ExtMapBuffer3, 0.0 );
   ArrayInitialize( ExtMapBuffer4, 0.0 );


   //Calculate Visible Bars
   _BarsCount = BarsPerWindow() + 1;
   int _FirstBar = FirstVisibleBar();
   int _LastBar = _FirstBar - _BarsCount + 1;
   if ( _LastBar < 0 ) {
      _LastBar = 0;
      _BarsCount = _FirstBar + 1;
   }


   //Calculate Chart Ratio
   _CurRangeHigh = High[Highest(NULL, 0, MODE_HIGH, _BarsCount, _LastBar)];
   _CurRangeLow = Low[Lowest(NULL, 0, MODE_LOW, _BarsCount, _LastBar)];
   _CurRangeCenter = ( _CurRangeHigh + _CurRangeLow ) / 2;

   if ( Mirroring ) {
      _SubRangeHigh = iLow( SubSymbol, 0, Lowest( SubSymbol, 0, MODE_LOW, _BarsCount, _LastBar ) );
      _SubRangeLow = iHigh( SubSymbol, 0, Highest( SubSymbol, 0, MODE_HIGH, _BarsCount, _LastBar ) );
   } else {
      _SubRangeHigh = iHigh( SubSymbol, 0, Highest( SubSymbol, 0, MODE_HIGH, _BarsCount, _LastBar ) );
      _SubRangeLow = iLow( SubSymbol, 0, Lowest( SubSymbol, 0, MODE_LOW, _BarsCount, _LastBar ) );
   }    

   _SubRangeCenter = ( _SubRangeHigh + _SubRangeLow ) / 2;
   _SubPoint = MarketInfo( SubSymbol, MODE_POINT );
   _SubDigit = MarketInfo( SubSymbol, MODE_DIGITS );

   _PipsRatio = ( _CurRangeHigh - _CurRangeLow )  / ( _SubRangeHigh - _SubRangeLow );

   _GridPips = ( _SubRangeHigh - _SubRangeLow ) / Grid;
   _GridPips = MathRound( ( _SubRangeHigh - _SubRangeLow ) / Grid / ( _SubPoint * SnapPips ) ) * ( _SubPoint * SnapPips );


   //Draw Candlesticks
        for ( _i = _LastBar; _i < _LastBar + _BarsCount; _i ++ ) {
      _SubOpen = iOpen( SubSymbol, 0, _i ) - _SubRangeCenter;
      _SubHigh = iHigh( SubSymbol, 0, _i ) - _SubRangeCenter;
      _SubLow = iLow( SubSymbol, 0, _i ) - _SubRangeCenter;
      _SubClose = iClose( SubSymbol, 0, _i ) - _SubRangeCenter;

      if ( Mirroring ) {
         if ( _SubOpen < _SubClose ) {
            ExtMapBuffer2[_i] = _CurRangeCenter + _SubHigh * _PipsRatio;
            ExtMapBuffer1[_i] = _CurRangeCenter + _SubLow * _PipsRatio;
         } else {
            ExtMapBuffer2[_i] = _CurRangeCenter + _SubLow * _PipsRatio;
            ExtMapBuffer1[_i] = _CurRangeCenter + _SubHigh * _PipsRatio;
         }

         ExtMapBuffer4[_i] = _CurRangeCenter + _SubClose * _PipsRatio;
         ExtMapBuffer3[_i] = _CurRangeCenter + _SubOpen * _PipsRatio;
      } else {
         if ( _SubOpen < _SubClose ) {
            ExtMapBuffer1[_i] = _CurRangeCenter + _SubHigh * _PipsRatio;
            ExtMapBuffer2[_i] = _CurRangeCenter + _SubLow * _PipsRatio;
         } else {
            ExtMapBuffer1[_i] = _CurRangeCenter + _SubLow * _PipsRatio;
            ExtMapBuffer2[_i] = _CurRangeCenter + _SubHigh * _PipsRatio;
         }
         ExtMapBuffer3[_i] = _CurRangeCenter + _SubClose * _PipsRatio;
         ExtMapBuffer4[_i] = _CurRangeCenter + _SubOpen * _PipsRatio;
      }
   }


   //Draw Objects
   ObjectCreate( Prefix + "Copyright", OBJ_LABEL, 0, 0, 0 );
        ObjectSet( Prefix + "Copyright", OBJPROP_COLOR, GridColor );
   ObjectSet( Prefix + "Copyright", OBJPROP_CORNER, 3 );
   ObjectSet( Prefix + "Copyright", OBJPROP_XDISTANCE, 4 );
   ObjectSet( Prefix + "Copyright", OBJPROP_YDISTANCE, 4 );
   ObjectSetText( Prefix + "Copyright", "OverLay Chart by S.B.T.", 8 );

   ObjectCreate( Prefix + "Status", OBJ_LABEL, 0, 0, 0 );
        ObjectSet( Prefix + "Status", OBJPROP_COLOR, GridColor );
   ObjectSet( Prefix + "Status", OBJPROP_CORNER, 0 );
   ObjectSet( Prefix + "Status", OBJPROP_XDISTANCE, 4 );
   ObjectSet( Prefix + "Status", OBJPROP_YDISTANCE, 16 );
   ObjectSetText( Prefix + "Status",
                  SubSymbol + " O = " + DoubleToStr( iOpen( SubSymbol, 0, _LastBar ), _SubDigit ) +
                  ", H = " + DoubleToStr( iHigh( SubSymbol, 0, _LastBar ), _SubDigit ) +
                  ", L = " + DoubleToStr( iLow( SubSymbol, 0, _LastBar ), _SubDigit ) +
                  ", C = " + DoubleToStr( iClose( SubSymbol, 0, _LastBar ), _SubDigit ),
                  8 );

        for ( _i = 1; _i <= Grid ; _i ++ ) {
      _GridPrice = MathRound( _SubRangeCenter / ( _SubPoint * SnapPips ) ) * ( _SubPoint * SnapPips );
      _GridPrice = ( ( _GridPrice + _GridPips / 2 ) + _GridPips * ( Grid / 2 - 1 ) ) - ( _GridPips * ( _i - 1 ) );

                ObjectCreate( Prefix + "Grid" + _i, OBJ_TREND, 0, 0, 0 );
      ObjectSet( Prefix + "Grid" + _i, OBJPROP_TIME1, Time[_FirstBar] );
      ObjectSet( Prefix + "Grid" + _i, OBJPROP_PRICE1, _CurRangeCenter + ( _GridPrice - _SubRangeCenter ) * _PipsRatio );
      ObjectSet( Prefix + "Grid" + _i, OBJPROP_TIME2, Time[_LastBar] );
      ObjectSet( Prefix + "Grid" + _i, OBJPROP_PRICE2, _CurRangeCenter + ( _GridPrice - _SubRangeCenter ) * _PipsRatio );
                ObjectSet( Prefix + "Grid" + _i, OBJPROP_COLOR, GridColor );
                ObjectSet( Prefix + "Grid" + _i, OBJPROP_STYLE, STYLE_DOT );
                ObjectSet( Prefix + "Grid" + _i, OBJPROP_WIDTH, 1 );
                ObjectSet( Prefix + "Grid" + _i, OBJPROP_RAY, true );

                ObjectCreate( Prefix + "Price" + _i, OBJ_TEXT, 0, 0, 0 );
      ObjectSet( Prefix + "Price" + _i, OBJPROP_TIME1, Time[_FirstBar - _BarsCount / 10] );
      ObjectSet( Prefix + "Price" + _i, OBJPROP_PRICE1, _CurRangeCenter + ( _GridPrice - _SubRangeCenter ) * _PipsRatio );
                ObjectSet( Prefix + "Price" + _i, OBJPROP_COLOR, GridColor );
      ObjectSetText( Prefix + "Price" + _i, DoubleToStr( _GridPrice, _SubDigit ), 8 );
   }


   return( 0 );
}
//+------------------------------------------------------------------+
 
try to change DRAW_HISTOGRAM by DRAW_LINE :IN SetIndexStyle( 0, DRAW_HISTOGRAM, DRAW_LINE, 1, BullBarColor );
 
How to named the line?
 

Hi guys.. I know this is an old thread, but i'm trying to get the line chart for overlay as I think that's the best way to view overlay charts.


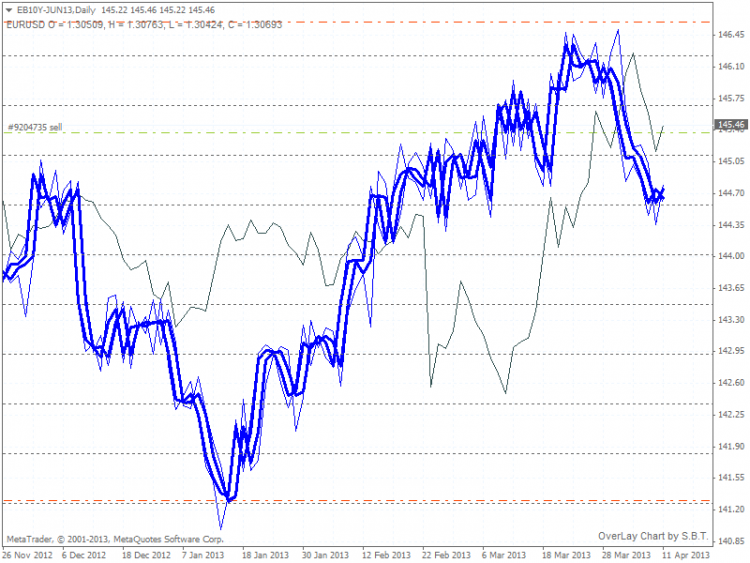
I changed DRAW_HISTOGRAM to DRAWLINE but it now displays a lot many lines. Refer to the picture below.


Overlay Chart

I think this has to do because of these pieces of code (and possibly others too). Because this indicator was written for Candles, thus we have Bull/Bear and the two outlines. Can someone help to correct this please?

//+------------------------------------------------------------------+
//| Custom indicator initialization function                         |
//+------------------------------------------------------------------+
int init() {

   //Initialize Indexes
   Prefix = "OverLayChart" + SubSymbol;

   IndicatorShortName( "OverLay Chart( " + SubSymbol + " )" );

   SetIndexBuffer( 0, ExtMapBuffer1 );
   SetIndexBuffer( 1, ExtMapBuffer2 );
   SetIndexBuffer( 2, ExtMapBuffer3 );
   SetIndexBuffer( 3, ExtMapBuffer4 );

   SetIndexStyle( 0, DRAW_LINE, DRAW_LINE, 1, BullBarColor );
   SetIndexStyle( 1, DRAW_LINE, DRAW_LINE, 1, BearBarColor );
   SetIndexStyle ( 2, DRAW_LINE, DRAW_LINE, 1, BullBarColor );
   SetIndexStyle( 3, DRAW_LINE, DRAW_LINE, 1, BearBarColor );

   SetIndexEmptyValue( 0, 0.0 );
   SetIndexEmptyValue( 1, 0.0 );
   SetIndexEmptyValue( 2, 0.0 );
   SetIndexEmptyValue( 3, 0.0 );


   return( 0 );
}
 
jb1981:

Hi guys.. I know this is an old thread, but i'm trying to get the line chart for overlay as I think that's the best way to view overlay charts.


I changed DRAW_HISTOGRAM to DRAWLINE but it now displays a lot many lines. Refer to the picture below.


I think this has to do because of these pieces of code (and possibly others too). Because this indicator was written for Candles, thus we have Bull/Bear and the two outlines. Can someone help to correct this please?


The linechart is same as    simple moving average  period one  close price

So why not place that moving average on the chart with your candlestick ??? 


Hi guys,

i know that this topic is old, but as I don't achieved show the graphic in lines...

Anybody knows how convert the histogram to lines? I think that it can't be too difficult to someone that knows programe for MT4 but unfortunately I'm a beginner.

Thanks in advice if someone can help.

Cheers. 


There is someone who added the MA. The coder is LEGRUPO.

The modified Overlay charts indicator is included here.

Files:
_ictasmt.zip  10 kb
 

Here is another one :

Files:
 
Can I put another timeframe linechart?
Reason: