Broker prices out of sync why?
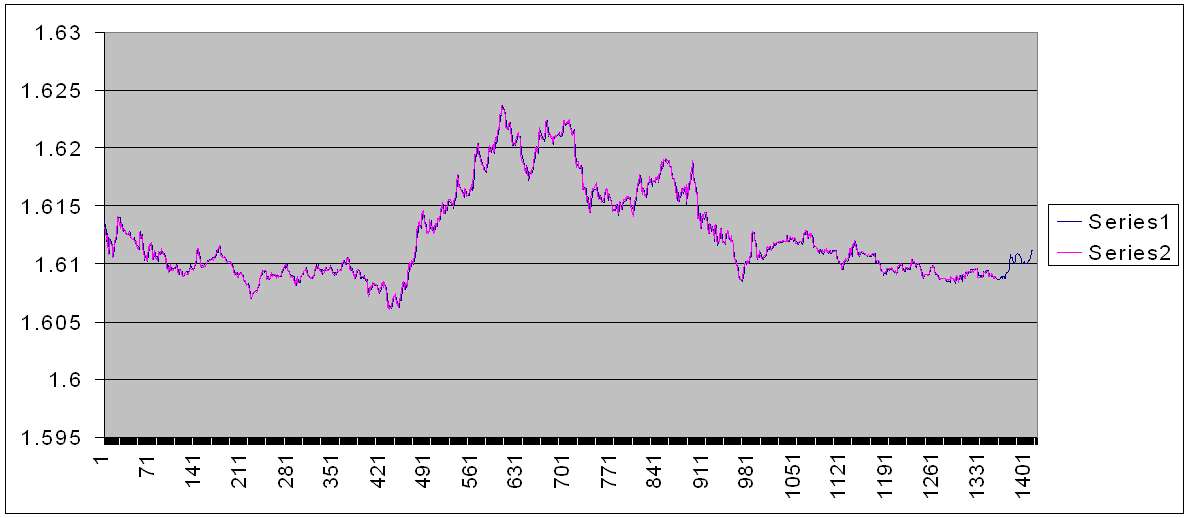
What is on the x-axis? You should dump it with date/time and put that on the x-axis
I suppose the blue one is missing some bars maybe because it has less ticks. So if I do it with 5 minute bars on the X axis instead of 1 minute bars they should line up. I shall see.
Ruptor:
I suppose the blue one is missing some bars maybe because it has less ticks. So if I do it with 5 minute bars on the X axis instead of 1 minute bars they should line up. I shall see.
I suppose the blue one is missing some bars maybe because it has less ticks. So if I do it with 5 minute bars on the X axis instead of 1 minute bars they should line up. I shall see.
Yeah, that's my guess too and why i suggested to put the actual time on the axis.
I've compared different brokers quotes and they always differ with few pips. Can be caused of spread difference and other quotes manipulations
Added padding for dropped bars so now they line up. They look quite close so I suppose the timescale would have to be 5 or 10 seconds to see bigger differences.
You are missing trading opportunities:
- Free trading apps
- Over 8,000 signals for copying
- Economic news for exploring financial markets
Registration
Log in
You agree to website policy and terms of use
If you do not have an account, please register
I wanted to compare broker prices so I used the back tester on 1 minute time scale and dumped the prices to a file for two different brokers. I accounted for the GMT differences and plotted the prices on a chart with minutes on the X axis expecting to see the prices following each other but they start out together then one lags the other by the end of the chart. It is not the midnight roll over because I limited the reading to 10 hours worth.
Does anybody have any idea what could be causing the problem?