Simple MACD question
For some reason it does not show the picture...
Hopefully this works.
All you get from the MACD indicator are the values of the histogram (the blue bars in your chart) and the signal (which is not in your chart).
If you want the value of the yellow or red lines, you have to get it directly from MA's, the yellow would be the Fast EMA and red the Slow EMA. The point where the 2 MA's cross is also where the blue bar is zero (as you found out), just simply where Slow EMA = Fast EMA.
You are missing trading opportunities:
- Free trading apps
- Over 8,000 signals for copying
- Economic news for exploring financial markets
Registration
Log in
You agree to website policy and terms of use
If you do not have an account, please register
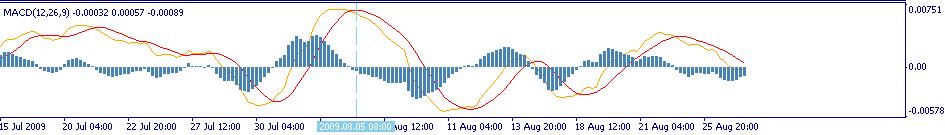
On this MACD you see a crossing of the MACD signal lines.
However, the value that the MACD gives is not of those MA lines but of the signal MACD.
So in this picture, I am looking to get the value of the yellow line that crosses at 0.00751.
How do I get that from the MACD?
What it gives me is the value of the histogram which at that point is a little below zero.
Please help!
Thanks.