Finally giving up the fight. Handing the iMAonArray(GRRRRRR) to you...don't let it kill your mind, keep a cool head...
Here's the one with my try to average it!
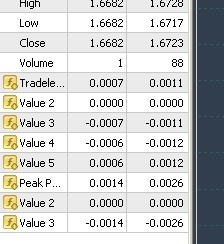
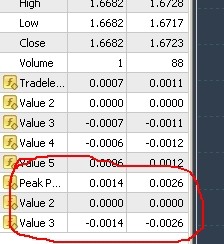
Your indy gives values like 0.0014 or 0.0008 etc...
You can not place it into the chart window, because there are values like 1.4253 or 0.8973 etc ...
Place the indy on a separate window, or modify the code.
Here is the "separate window" version (+ some minor changes):
Bye, GG
Your indy gives values like 0.0014 or 0.0008 etc...
You can not place it into the chart window, because there are values like 1.4253 or 0.8973 etc ...
Place the indy on a separate window, or modify the code.
Here is the "separate window" version (+ some minor changes):
Bye, GG
reading this... just had to comment.
How great it is to see help like this given freely
Well done GG
:o)
Your indy gives values like 0.0014 or 0.0008 etc...
You can not place it into the chart window, because there are values like 1.4253 or 0.8973 etc ...
Place the indy on a separate window, or modify the code.
Here is the "separate window" version (+ some minor changes):
Bye, GG
Thanks a lot for your effort, ggekko,
and it really is a source of knowledge here, fbj,
but the iMAonArray function still is a little mystery to me. When you look at the first version of my Indi, the one without MA, values like 1.4002 and 1.4125 are normal and in the chart window and do not exceed the price by more than 100pips. Why does iMAonArray return values like 0.3082 or 2.5646? A bug?
Your indicators (PeakPerfection and AMATrade...)give these values in the Data Window:
MMHHH, Something went seriously wrong here then.
Have a look at this:
Before reinstallation of MetaTrader
And after reinstallation:
So what is going on here? I think some of the developers are asked to help...
It might have to do with my broker changing to 5 digits but ... actually I feel a little helpless! Will change the broker anyway to 4 digits...5 digits is awful
Maybe there is a difference between your and 'mine' PeakP version (see the labels in the Data Window):
In your video:
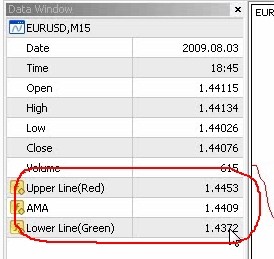
Mine:
That was the problem:
In your PP indy there was:
iCustom(NULL,0,"AMA_STL",AMAFast ...
instead of
iCustom(NULL,0,"AMA STL",AMAFast ...
I have fixed it and now works:
- Free trading apps
- Over 8,000 signals for copying
- Economic news for exploring financial markets
You agree to website policy and terms of use
Hi,
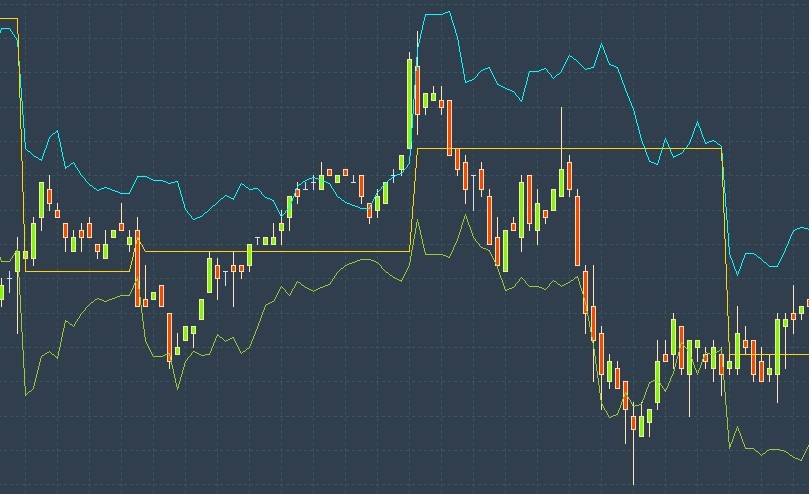
I am FINISHED! I have tried everything possible to get my MA onto the Overbought and Oversold lines. But nothing worked. The Lines are drawn without problems when I didn't try to build an Average.
But then I struggle to get a Moving Average of these green and red lines.
Because It's one of my first codes, I'd kindly not just ask for the solution but also for a tiny Explanation of the solved problem....
Your Help is much appreciated...honestly...
Attached is my first version without MA and the one with my attempt :D...not so many comments in the second one...
If the AMA is needed download it here, please:
AMA_STL