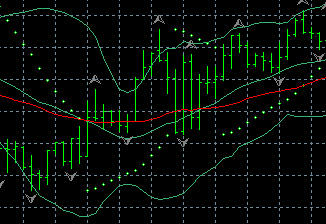
I use iBands in my EA but I cannot seem to identify the middle moving average of the bends.
Any idea on how to get the middle line value since iBands only uses MODE_LOWER and MODE_UPPER?
I tried using iMA with no luck.
Here is my value for the bends:
Not sure but wouldn't a simple average of the above 2 solve your problem because, both the lines are equidistant from the average. ? Let me know if it is true !!
Not sure but wouldn't a simple average of the above 2 solve your problem because, both the lines are equidistant from the average. ? Let me know if it is true !!
I think I failed to explain
x=iBands(NULL,0,20,2,0,PRICE_CLOSE,MODE_LOWER,0);
y=iBands(NULL,0,20,2,0,PRICE_CLOSE,MODE_UPPER,0);
Z=(x+y)/2;
Isn't this what you are looking for ?
Lemme know.
Thanks guys a lot!
Yeah, I used the SMA without the shift and its exact! Exactly what I was looking for. Thanks again 23510 and skt1977 for your help.
Hi
I had that problem but found the custom indicator called Bands that comes with MT4 as standard. You can get all the lines from that using 0,1,2 as the mode settings so there is no need to call a separate indicator. Just thought I would add my two peneth.
Hi Doshur
Thanks but how come you know that and nobody else does? Where did you find out about it? Perhaps you read between the lines expertly figuring out that if MODE_UPPER=1 and MODE_LOWER=2 then MODE_MAIN=0 because there must be a 0 buffer and it probably contains the middle line?
Hey,
Use F1 with UltraEdit:
Indicator line identifiers used in iMACD(), iRVI() and iStochastic() indicators.
Indicator line identifiers used in iADX() indicator.
Indicator line identifiers used in iBands(), iEnvelopes(), iEnvelopesOnArray(), iFractals() and iGator() indicators.
|
Excuse me for asking .... Could you possibly be asking about something the "Z Score"? The "Z Score" is Z = [(X - Mean) / StnDev]. Therefore the current value (X) minus the average (Mean) is divided by the current standard deviation (StnDev). Hence, the "Z Score" will tell you exactly where the current price (X) is away from the population average and where within the normally distributed "Bell Curve".
The complexity of this grows when we discuss the period or sample size. However, the sample size for the Mean and the Standard Deviation MUST be 30 samples! Otherwise we MUST use the "Students t-distribution" that closely approximates the Standard Deviation (StnDev) used within the "Z-Score".
If you want to use less then a sample size of 30 (even by one like 29 periods), then it would be very wise to use the "Students t-distribution"! (see https://www.mql5.com/en/articles/271 then go down to section titled "2.1.5 Student's t-Distribution"). It was debated between the experts in the past as to how many samples or periods to include before the both the "Z Score" and the "Student's t-Distribution" where close enough. They decided the number of samples should be 30. Hence, I highlighted the "MUST" above.
I hope this clarifies the situation.
....GOD Bless!!!

- 2011.11.30
- Dennis Kirichenko
- www.mql5.com
- Free trading apps
- Over 8,000 signals for copying
- Economic news for exploring financial markets
You agree to website policy and terms of use

I use iBands in my EA but I cannot seem to identify the middle moving average of the bends.
Any idea on how to get the middle line value since iBands only uses MODE_LOWER and MODE_UPPER?
I tried using iMA with no luck.
Here is my value for the bends: