SanMiguel,
I suppose the problem in your code is here:
for(i=0;i<Bars;i++)
{
   datetime dtStart = iTime(NULL,PERIOD_M15,i-4);
   datetime dtEnd = iTime(NULL,PERIOD_M15,i);
}
It actually creates the lines but you are not seeing them because they are at the beginning of the chart, in the past. This for cycle is meaningless. You also have to use
ObjectDelete() before ObjectCreate() in case your lines already exist.
I noticed another errors in your code.
Try this:
int start()
{
   int    counted_bars=IndicatorCounted();
//----

//testing variable
double inputlevel = 1.5898;
int i;
double level1=inputlevel+(20*Point*10); //+20pips
double level2=inputlevel+(30*Point*10); //+30pips
double level3=inputlevel+(40*Point*10); //+40pips
double level4=inputlevel+(80*Point*10); //+80pips

for(i=Bars;i>=4;i--)
{
    datetime dtStart = iTime(NULL,PERIOD_M15,i-4);
    datetime dtEnd = iTime(NULL,PERIOD_M15,i);

    ObjectDelete("Line1");
    ObjectCreate("Line1",OBJ_TREND,0,dtStart,level1, dtEnd, level1);
    ObjectSet("Line1",OBJPROP_COLOR,Red);
    ObjectSet("Line1",OBJPROP_STYLE,STYLE_SOLID);
    ObjectSet("Line1", OBJPROP_RAY, false);
    ObjectSet("Line1",OBJPROP_WIDTH,1);

    ObjectDelete("Line2");
    ObjectCreate("Line2",OBJ_TREND,0,dtStart,level2, dtEnd, level2);
    ObjectSet("Line2",OBJPROP_COLOR,Red);
    ObjectSet("Line2",OBJPROP_STYLE,STYLE_SOLID);
    ObjectSet("Line2", OBJPROP_RAY, false);
    ObjectSet("Line2",OBJPROP_WIDTH,1);

    ObjectDelete("Line3");
    ObjectCreate("Line3",OBJ_TREND,0,dtStart,level3, dtEnd, level3);
    ObjectSet("Line3",OBJPROP_COLOR,Red);
    ObjectSet("Line3",OBJPROP_STYLE,STYLE_SOLID);
    ObjectSet("Line3", OBJPROP_RAY, false);
    ObjectSet("Line3",OBJPROP_WIDTH,1);

    ObjectDelete("Line4");
    ObjectCreate("Line4",OBJ_TREND,0,dtStart,level4, dtEnd, level4);
    ObjectSet("Line4",OBJPROP_COLOR,Red);
    ObjectSet("Line4",OBJPROP_STYLE,STYLE_SOLID);
    ObjectSet("Line4", OBJPROP_RAY, false);
    ObjectSet("Line4",OBJPROP_WIDTH,1);
}

//----
   return(0);
}
SanMiguel,
I suppose the problem in your code is here:
Should it be this:
for(i=Bars;i>=-4;i--)
instead of +4?
Still doesn't draw anything...
+4 of course..
It draws the lines on my chart. Check your inputlevel variable. Maybe it is set to a value too high or too low.
Aha, thanks - seems to work this time.
However, as an indicator, if I add a new indicator it doesn't delete the lines of the other indicator - that correct?
Maybe I'll try it as a script.
How do I get external inputs to a script to test?
And to extend the line to the right - do I use:
datetime dtEnd = iTime(NULL,PERIOD_M15,i+4); ?
Aha, thanks - seems to work this time.
However, as an indicator, if I add a new indicator it doesn't delete the lines of the other indicator - that correct?
Maybe I'll try it as a script.
Sorry, didn't get what the problem is when run as an indicator...
It works both ways for me.
Sorry, didn't get what the problem is when run as an indicator...
It works both ways for me.
I add indicator lines.mql4 and it adds the lines.
When I add another indicator (the same one), so I now have 2 indicators called lines.mql4 on the chart, it doesn't delete the old lines.
How do I get external inputs to a script to test?
And to extend the line to the right - do I use:
datetime dtEnd = iTime(NULL,PERIOD_M15,i+4); ?
Why add the same indicator to the chart twice?
In order to extend the lines to the left (you cannot extend them to the right before new candles appear) change datetime dtEnd = iTime(NULL,PERIOD_M15,i+10); and the for cycle for(i=Bars;i>=10;i--)
For external inputs for a script you may use extern variables.
To extend them automatically to the right, would I just add Ray to the properties? That seems to add a line across the entire screen.
To extend them automatically to the right, would I just add Ray to the properties?
If you use the code as an indicator the lines will move to the right automatically.
- Free trading apps
- Over 8,000 signals for copying
- Economic news for exploring financial markets
You agree to website policy and terms of use

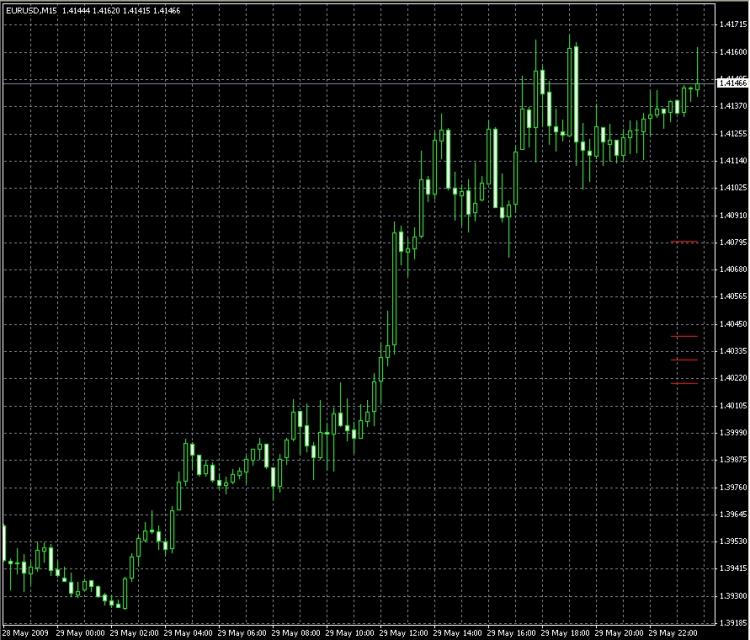
I am trying to draw 4 lines based on an input value, which will eventually be the order open price.
This should place lines at +20pips, +30, +40 and +80. Each line should be about 4 to 5 candles wide.
The code below doesn't draw anything. Any ideas why?