Boy do I love the beginning of 2007
what exactly changed since that point?
try to look at the details. try to look next to what you think is the cause...
jmca
Check out the Daily ATR (24) for your chosen pair
I think it likely that this was in decline or just low during the bad time - also likely your results started to drop mid-Nov 2008 for the same reason?
Many systems (manual or auto) should just not be used when volatility is low &/or dropping
Perhaps try a filter based on
...
if (Daily.ATR < SomeThreshold) AllowTrade=false;
...
You would need somthing a little funkier to detect a dropping ATR
FWIW
-BB-
Did all that. I can't find any visible clues. It definitely baffles me. Not sue what to hone in on or try to filter out. From another post:
I know a few scalpers that stopped working in 2006. It had something to do with the currency prices. As an example, check these EURGBP 1M prices from the MQ server before and after 09-29-06 14:20. Notice the High-Low range before and after.
You can try Alpari history. But that is very likely to be different from MT4 history. Which would be different from your broker's history again. Even when running exactly the same EA for the same period.
Part of the reason is "fixed" thresholds like take_profit_pips which statistically may be optimal for one period/broker, but quite disastrous for another. Visibly there would probably be very few clues, but if you dump the history in text format and load it into a spreadsheet or database to do some statistical analysis you may find something - which is probably what you already know - that these things change.
One approach is to make these thresholds a bit more dynamic, ie to incorporate some form of dynamic adjustments to these parameters values along with TP/SL based on what your favorite indicators/signals are telling you. Usually easier said than done. :)
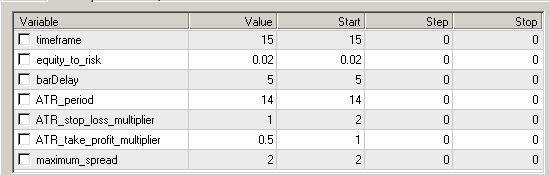
Here is a version with dynamic SL & TP using ATR. Same problem. Attached is the source. Please feel free to try other things out. If anybody does find a solution, don't be greedy, please share.
yes it can seem like a black-art and not any form of science
I've had one (previously) very reliable EA lose the plot in spite of improving ATR this last 10 days :(
So theres more to it, at least some of the time...
Also, I'm still after a unified theory as to why some EA's work on sub-pip but not full-pip, and vice versa of course!
FWIW
-BB-
- Free trading apps
- Over 8,000 signals for copying
- Economic news for exploring financial markets
You agree to website policy and terms of use
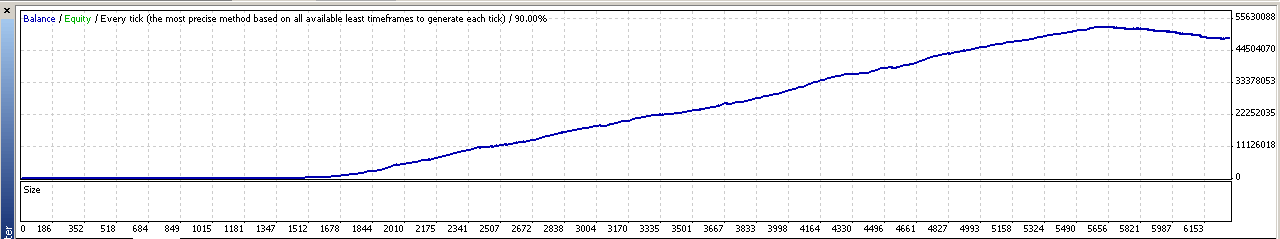
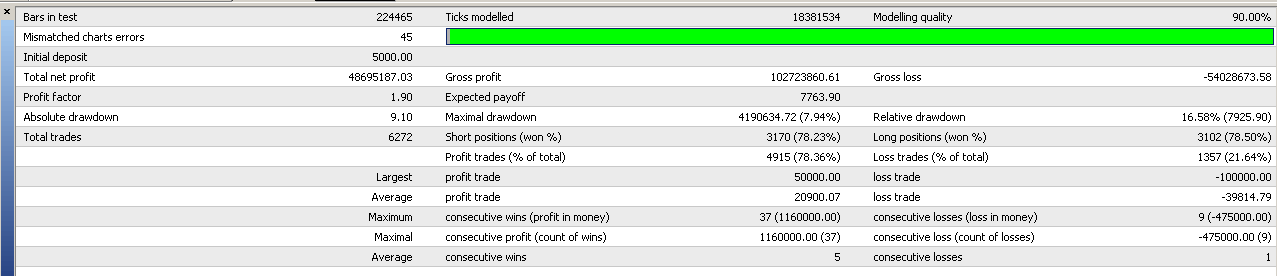
So I'm developing another EA using 2 indicators. Everything's chugging away until it hits 01/01/2007. Then BOOM everything crashes again from 2007+. This is the 2nd EA that I've designed that does this. Both EA entering criteria are completely different, yet both still crash at 2007+. Does anybody have access to test this EA with historical data OTHER than MT4's source?
Settings:
2000-2006:
2000-2008:
2007+