One of my EA's (conservative!) - comment please
Looks like you have something. Drawdown is good. One thing is that it is only about 8% ROI/year, not that much for a risky investment. You did say this was a conservative test. What do you have for a moderate risk?
Thanks for your reply.
For moderate risk i'm developing another 3 days ago. Here are some provisory results.
MM is the same method, lots and everything.
What do you think about the red numbers??
Strategy Tester Report
| Symbol | EURUSD (Euro vs US Dollar) | ||||
| Period | 5 Minutes (M5) 1999.01.04 19:40 - 2009.01.05 21:25 | ||||
| Model | Every tick (the most precise method based on all available least timeframes) | ||||
| Bars in test | 738384 | Ticks modelled | 22717781 | Modelling quality | 89.99% |
| Mismatched charts errors | 4 | ||||
| Initial deposit | 10000.00 | ||||
| Total net profit | 205749.76 | Gross profit | 724261.28 | Gross loss | -518511.52 |
| Profit factor | 1.40 | Expected payoff | 79.72 | ||
| Absolute drawdown | 1985.60 | Maximal drawdown | 14861.12 (11.04%) | Relative drawdown | 35.66% (5855.84) |
| Total trades | 2581 | Short positions (won %) | 1267 (60.38%) | Long positions (won %) | 1314 (63.09%) |
| Profit trades (% of total) | 1594 (61.76%) | Loss trades (% of total) | 987 (38.24%) | ||
| Largest | profit trade | 3360.00 | loss trade | -1463.04 | |
| Average | profit trade | 454.37 | loss trade | -525.34 | |
| Maximum | consecutive wins (profit in money) | 18 (8936.80) | consecutive losses (loss in money) | 9 (-292.80) | |
| Maximal | consecutive profit (count of wins) | 9123.20 (5) | consecutive loss (count of losses) | -5760.00 (7) | |
| Average | consecutive wins | 3 | consecutive losses | 2 | |
That seems like a nice curve. Drawdown not too bad. Run a test of the months where the curves dip (where the drawdown is most). I'm curious how the MM will handle that and recover the account, let's say if you started live and started with a losing curve. Also, I'm not sure your MM strategy, but try a variation of fixed lots up to a certain amount than double the lots (ex: 1000-2000 = 0.02, 2000-3000 = 0.04), or something along those lines.
jmca, i will try your suggestions and reply very soon. I made a run risking only 1% of the initial deposit (before was 5%). this is, if i lose by my predefined SL (300) it means i lose 1% of 10000 USD. So lots here are 0.3, 0.6 or 0.9.
follow the results.
| Symbol | EURUSD (Euro vs US Dollar) | ||||
| Period | 5 Minutes (M5) 1999.01.04 19:40 - 2009.01.05 21:25 | ||||
| Model | Every tick (the most precise method based on all available least timeframes) | ||||
| Bars in test | 738384 | Ticks modelled | 22717781 | Modelling quality | 89.99% |
| Mismatched charts errors | 4 | ||||
| Initial deposit | 10000.00 | ||||
| Total net profit | 34822.68 | Gross profit | 117448.99 | Gross loss | -82626.31 |
| Profit factor | 1.42 | Expected payoff | 13.49 | ||
| Absolute drawdown | 321.44 | Maximal drawdown | 2253.04 (6.72%) | Relative drawdown | 9.09% (1007.60) |
| Total trades | 2581 | Short positions (won %) | 1267 (60.38%) | Long positions (won %) | 1314 (63.09%) |
| Profit trades (% of total) | 1594 (61.76%) | Loss trades (% of total) | 987 (38.24%) | ||
| Largest | profit trade | 643.73 | loss trade | -309.21 | |
| Average | profit trade | 73.68 | loss trade | -83.71 | |
| Maximum | consecutive wins (profit in money) | 18 (1581.77) | consecutive losses (loss in money) | 9 (-40.36) | |
| Maximal | consecutive profit (count of wins) | 1742.21 (9) | consecutive loss (count of losses) | -887.51 (8) | |
| Average | consecutive wins | 3 | consecutive losses | 2 | |
Here are other options:
Fixed Lots, Risk 1% = 0.3 lots (FXPro)
| Initial deposit | 10000.00 | ||||
| Total net profit | 17093.25 | Gross profit | 76887.48 | Gross loss | -59794.22 |
| Profit factor | 1.29 | Expected payoff | 6.62 | ||
| Absolute drawdown | 231.36 | Maximal drawdown | 1347.80 (5.94%) | Relative drawdown | 6.85% (828.05) |
| Total trades | 2581 | Short positions (won %) | 1267 (60.38%) | Long positions (won %) | 1314 (63.09%) |
| Profit trades (% of total) | 1594 (61.76%) | Loss trades (% of total) | 987 (38.24%) | ||
| Largest | profit trade | 247.24 | loss trade | -107.08 | |
| Average | profit trade | 48.24 | loss trade | -60.58 | |
| Maximum | consecutive wins (profit in money) | 18 (925.31) | consecutive losses (loss in money) | 9 (-40.36) | |
| Maximal | consecutive profit (count of wins) | 925.31 (18) | consecutive loss (count of losses) | -608.89 (8) | |
| Average | consecutive wins | 3 | consecutive losses | 2 | |
Multiplied Lots, Risk 1% = 0.3/0.6/0.9 lots (FXPro)

| Initial deposit | 10000.00 | ||||
| Total net profit | 34822.68 | Gross profit | 117448.99 | Gross loss | -82626.31 |
| Profit factor | 1.42 | Expected payoff | 13.49 | ||
| Absolute drawdown | 321.44 | Maximal drawdown | 2253.04 (6.72%) | Relative drawdown | 9.09% (1007.60) |
| Total trades | 2581 | Short positions (won %) | 1267 (60.38%) | Long positions (won %) | 1314 (63.09%) |
| Profit trades (% of total) | 1594 (61.76%) | Loss trades (% of total) | 987 (38.24%) | ||
| Largest | profit trade | 643.73 | loss trade | -309.21 | |
| Average | profit trade | 73.68 | loss trade | -83.71 | |
| Maximum | consecutive wins (profit in money) | 18 (1581.77) | consecutive losses (loss in money) | 9 (-40.36) | |
| Maximal | consecutive profit (count of wins) | 1742.21 (9) | consecutive loss (count of losses) | -887.51 (8) | |
| Average | consecutive wins | 3 | consecutive losses | 2 | |
MM Formula, Risk 1% = 0.3 Start and 2.0 Finish
| Initial deposit | 10000.00 | ||||
| Total net profit | 60644.76 | Gross profit | 324186.67 | Gross loss | -263541.91 |
| Profit factor | 1.23 | Expected payoff | 23.50 | ||
| Absolute drawdown | 231.36 | Maximal drawdown | 8852.23 (11.62%) | Relative drawdown | 13.88% (3853.42) |
| Total trades | 2581 | Short positions (won %) | 1267 (60.38%) | Long positions (won %) | 1314 (63.09%) |
| Profit trades (% of total) | 1594 (61.76%) | Loss trades (% of total) | 987 (38.24%) | ||
| Largest | profit trade | 1289.37 | loss trade | -571.51 | |
| Average | profit trade | 203.38 | loss trade | -267.01 | |
| Maximum | consecutive wins (profit in money) | 18 (1073.15) | consecutive losses (loss in money) | 9 (-257.57) | |
| Maximal | consecutive profit (count of wins) | 4008.65 (5) | consecutive loss (count of losses) | -3600.95 (7) | |
| Average | consecutive wins | 3 | consecutive losses | 2 | |
jmca suggestion, double the lots (ex: 1000-2000 = 0.02, 2000-3000 = 0.04) type Fibonacci Sequence and the 3 levels. Starts with 0.3 lots.
| Bars in test | 738384 | Ticks modelled | 22717781 | Modelling quality | 89.99% |
| Mismatched charts errors | 4 | ||||
| Initial deposit | 10000.00 | ||||
| Total net profit | 259977.75 | Gross profit | 903572.58 | Gross loss | -643594.83 |
| Profit factor | 1.40 | Expected payoff | 100.73 | ||
| Absolute drawdown | 1445.15 | Maximal drawdown | 18024.04 (10.04%) | Relative drawdown | 35.51% (8174.19) |
| Total trades | 2581 | Short positions (won %) | 1267 (60.38%) | Long positions (won %) | 1314 (63.09%) |
| Profit trades (% of total) | 1594 (61.76%) | Loss trades (% of total) | 987 (38.24%) | ||
| Largest | profit trade | 5149.85 | loss trade | -2473.66 | |
| Average | profit trade | 566.86 | loss trade | -652.07 | |
| Maximum | consecutive wins (profit in money) | 18 (2809.89) | consecutive losses (loss in money) | 9 (-322.83) | |
| Maximal | consecutive profit (count of wins) | 13937.68 (9) | consecutive loss (count of losses) | -6727.79 (7) | |
| Average | consecutive wins | 3 | consecutive losses | 2 | |
I made a study about the period of the maximal drawdown verified.
| Bars in test | 65370 | Ticks modelled | 2174646 | Modelling quality | 90.00% |
| Mismatched charts errors | 0 | ||||
| Initial deposit | 10000.00 | ||||
| Total net profit | -150.16 | Gross profit | 7848.28 | Gross loss | -7998.44 |
| Profit factor | 0.98 | Expected payoff | -0.63 | ||
| Absolute drawdown | 1892.42 | Maximal drawdown | 2088.84 (20.49%) | Relative drawdown | 20.49% (2088.84) |
| Total trades | 237 | Short positions (won %) | 110 (52.73%) | Long positions (won %) | 127 (65.35%) |
| Profit trades (% of total) | 141 (59.49%) | Loss trades (% of total) | 96 (40.51%) | ||
| Largest | profit trade | 338.37 | loss trade | -223.94 | |
| Average | profit trade | 55.66 | loss trade | -83.32 | |
| Maximum | consecutive wins (profit in money) | 13 (462.95) | consecutive losses (loss in money) | 6 (-742.48) | |
| Maximal | consecutive profit (count of wins) | 663.20 (8) | consecutive loss (count of losses) | -742.48 (6) | |
| Average | consecutive wins | 3 | consecutive losses | 2 | |
That's pretty dam good. The drawdown on all scenarios are consistently decent, even on entering the dips. ROI is good on all these, minus the dip of course. You might have a decent system here. Just curious, since it's on a 5 min timeframe, how many orders are you placing per bar? Some brokers have a cap of orders per bar to deter extreme scalping. You should stick this on a demo soon and forward test for a quarter or 2.
Hi, this is the Strategy Report of my Fenix EA.
I used a very simple MM - 3 degrees of risk/reward instead of exponential formulas. This give me a better look of is performance.
Strategy Report of 1999-01-01 at 2008-12-31.
Appreciate please.
The first results are very good. The miximum drawdown is small (I like to see below 10%), the profit factor is high (anything above 2 is good), the % of winning trades is close to 90, the maximum and average loss trades are close to profit trades. What strategy do you use? And how do you weed out bad trades? I use stochastics for that purpose. RSI may work too, but not as good.
Send me an email if you prefer to discuss your strategy in private: gpwr9k95@yahoo.com
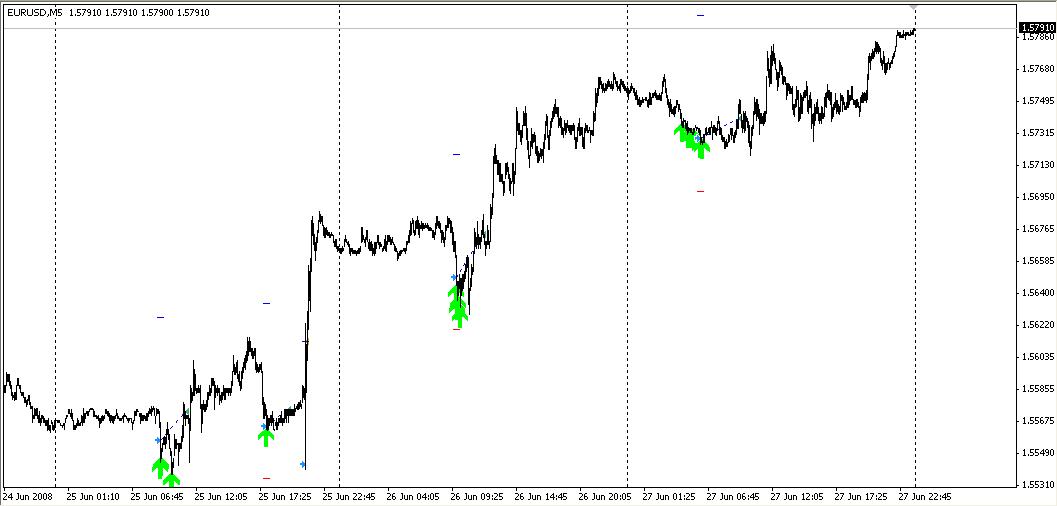
Here is a picture of the visual mode. I believe that closes could be better, some early entrys,... Like i said, still in development.
The first results are very good. The miximum drawdown is small (I like to see below 10%), the profit factor is high (anything above 2 is good), the % of winning trades is close to 90, the maximum and average loss trades are close to profit trades. What strategy do you use? And how do you weed out bad trades? I use stochastics for that purpose. RSI may work too, but not as good.
Send me an email if you prefer to discuss your strategy in private: gpwr9k95@yahoo.com
Hi gpwr, i only use sthocastics and rsi to open and close positions. I also use an angle indicator to determine the overal trend and open only in that direction. This last indicator multiplies my minimum defined lot. Proportional SL, TP and TS to the Timeframe used do the rest.
The only problem i see is that only open 1 or 2 positions in 5 days, because the open sthocastics dont reach easely the level to trigger the signal in a strong trend move.
- Free trading apps
- Over 8,000 signals for copying
- Economic news for exploring financial markets
You agree to website policy and terms of use
Hi, this is the Strategy Report of my Fenix EA.
I used a very simple MM - 3 degrees of risk/reward instead of exponential formulas. This give me a better look of is performance.
Strategy Report of 1999-01-01 at 2008-12-31.
Appreciate please.